在R中制作县份区分地图时,阿拉斯加和夏威夷的格式显示不正确

7

我正在尝试将美国的区域地图(Choropleth Map)格式化为特定颜色,不幸的是,在使用 scale_fill_brewer 更改颜色时,只有 48 个州生效(夏威夷和阿拉斯加不行)。是否可能让夏威夷和阿拉斯加也应用这种着色方案呢?

library(choroplethr) 
library(choroplethrMaps)
library(ggplot2) 
data(df_pop_county)

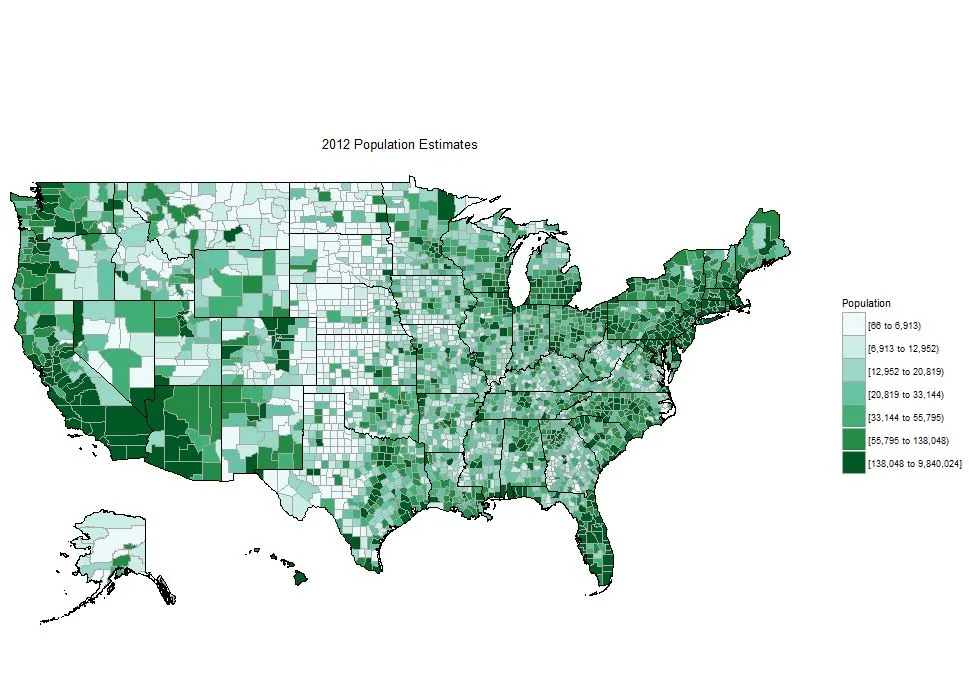
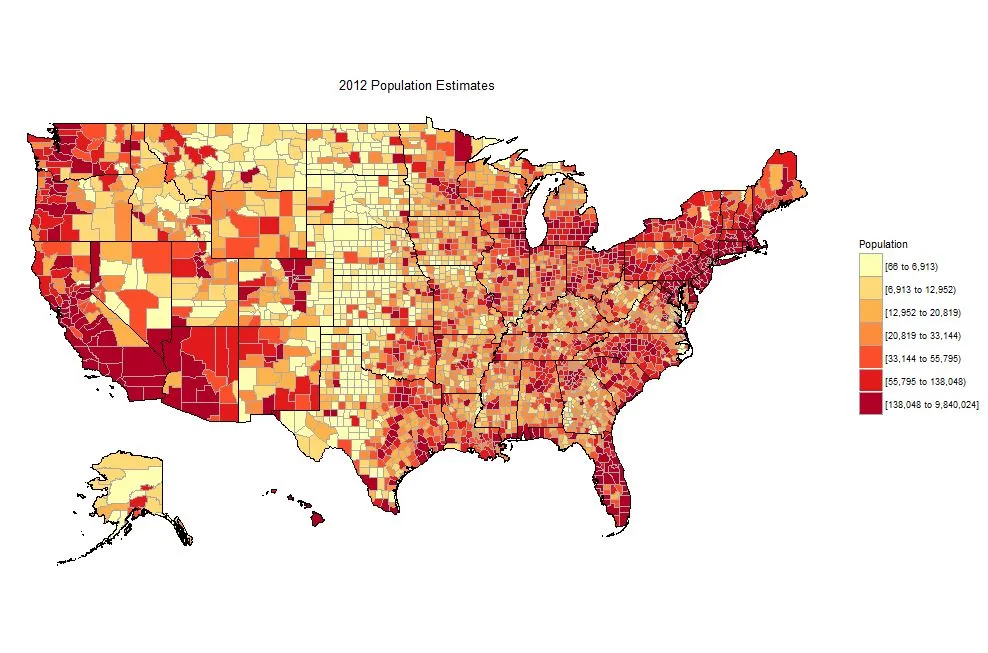
county_choropleth(df_pop_county, title = "Title1", legend = "Top 20% of Index", num_colors = 9) + 

geom_polygon(aes(fill=value), color="white")  + 

scale_fill_brewer(name="Top Index", palette="YlOrRd")
1个回答

6

要使用此选项并正确更新所有状态,我们可以按以下方式将其作为R6对象处理:

library(choroplethr) 
library(choroplethrMaps)
library(ggplot2) 
data(df_pop_county)

choro              = CountyChoropleth$new(df_pop_county)
choro$title        = "2012 Population Estimates"
choro$ggplot_scale = scale_fill_brewer(name="Population", palette=2, drop=FALSE)
choro$render()

在此输入图片描述

使用您提到的特定调色板:

choro              = CountyChoropleth$new(df_pop_county)
choro$title        = "2012 Population Estimates"
choro$ggplot_scale = scale_fill_brewer(name="Population", palette="YlOrRd", drop=FALSE)
choro$render()

enter image description here


网页内容由stack overflow 提供, 点击上面的
可以查看英文原文,
原文链接