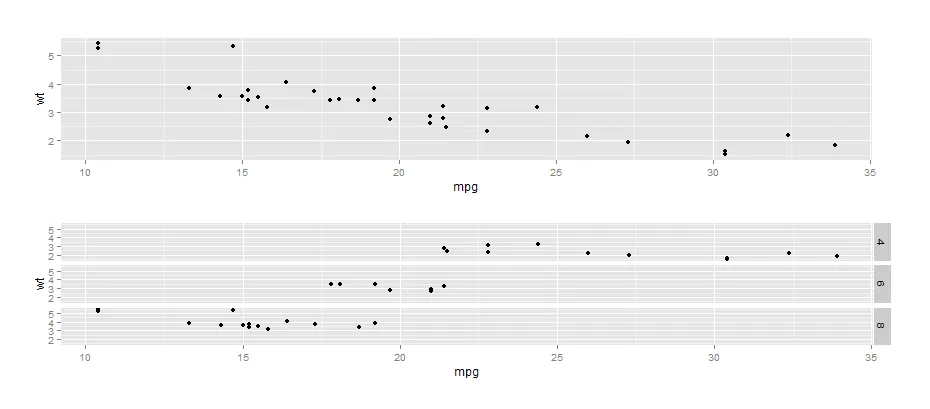
我有两张图表,我想将它们叠放在一起,放置方式如下:
library(ggplot2)
library(gridExtra)
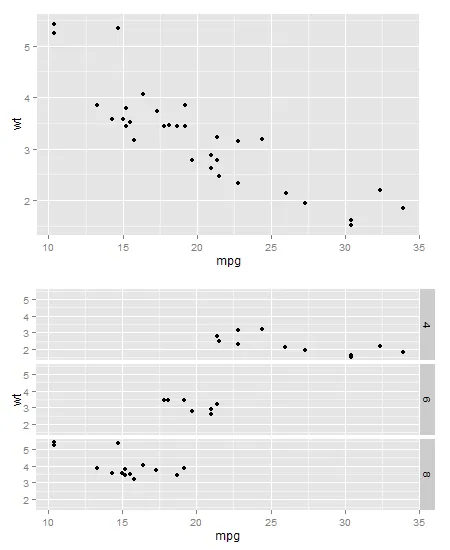
p1 <- ggplot(mtcars, aes(mpg, wt)) + geom_point()
p2 <- ggplot(mtcars, aes(mpg, wt)) + geom_point()
p2 <- p2 + facet_grid(cyl ~ .)
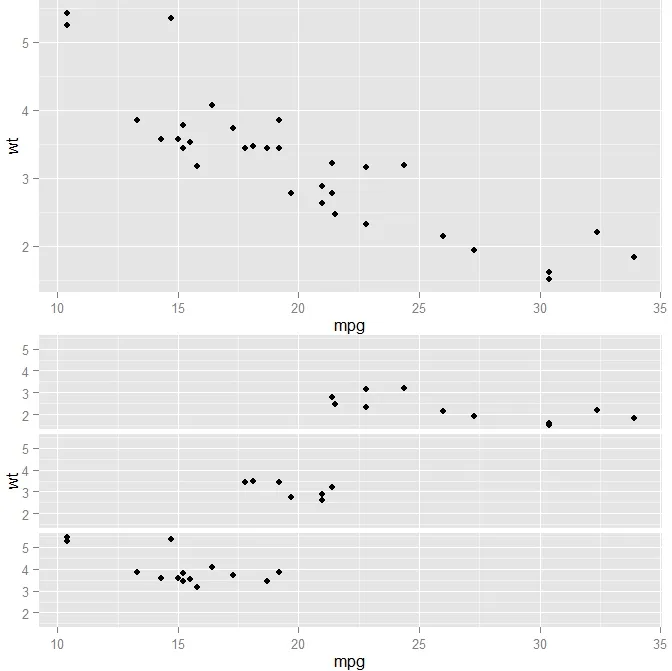
grid.arrange(p1, p2, ncol=1)
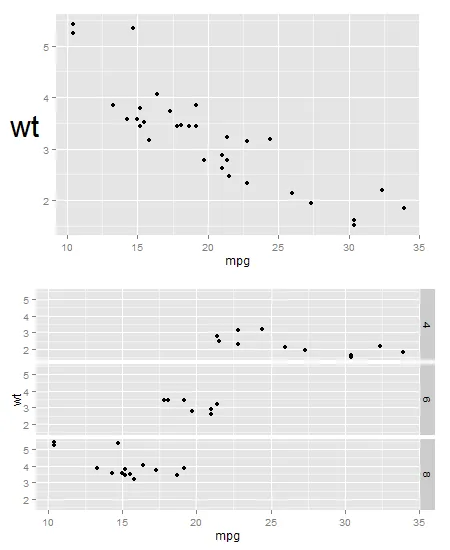
为此,我需要使上下两个图的x轴对齐,但由于左侧的条形图,分面图比上部图表更窄。我可以使用以下代码使条形图不可见:
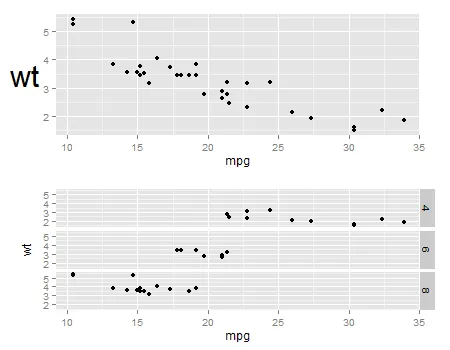
theme(strip.text.y = element_blank())
theme(strip.background = element_blank())
然而,这并不能消除条带占据的空间。因此,我需要一种方法来完全删除条带,或者将我的分面图分成单独的图形,但在它们之间共享同一个y轴标签的方式。在我的图中,我有两个不是很高的分面面板,它们没有足够的空间来拥有适当大小的y轴。
有什么建议吗?