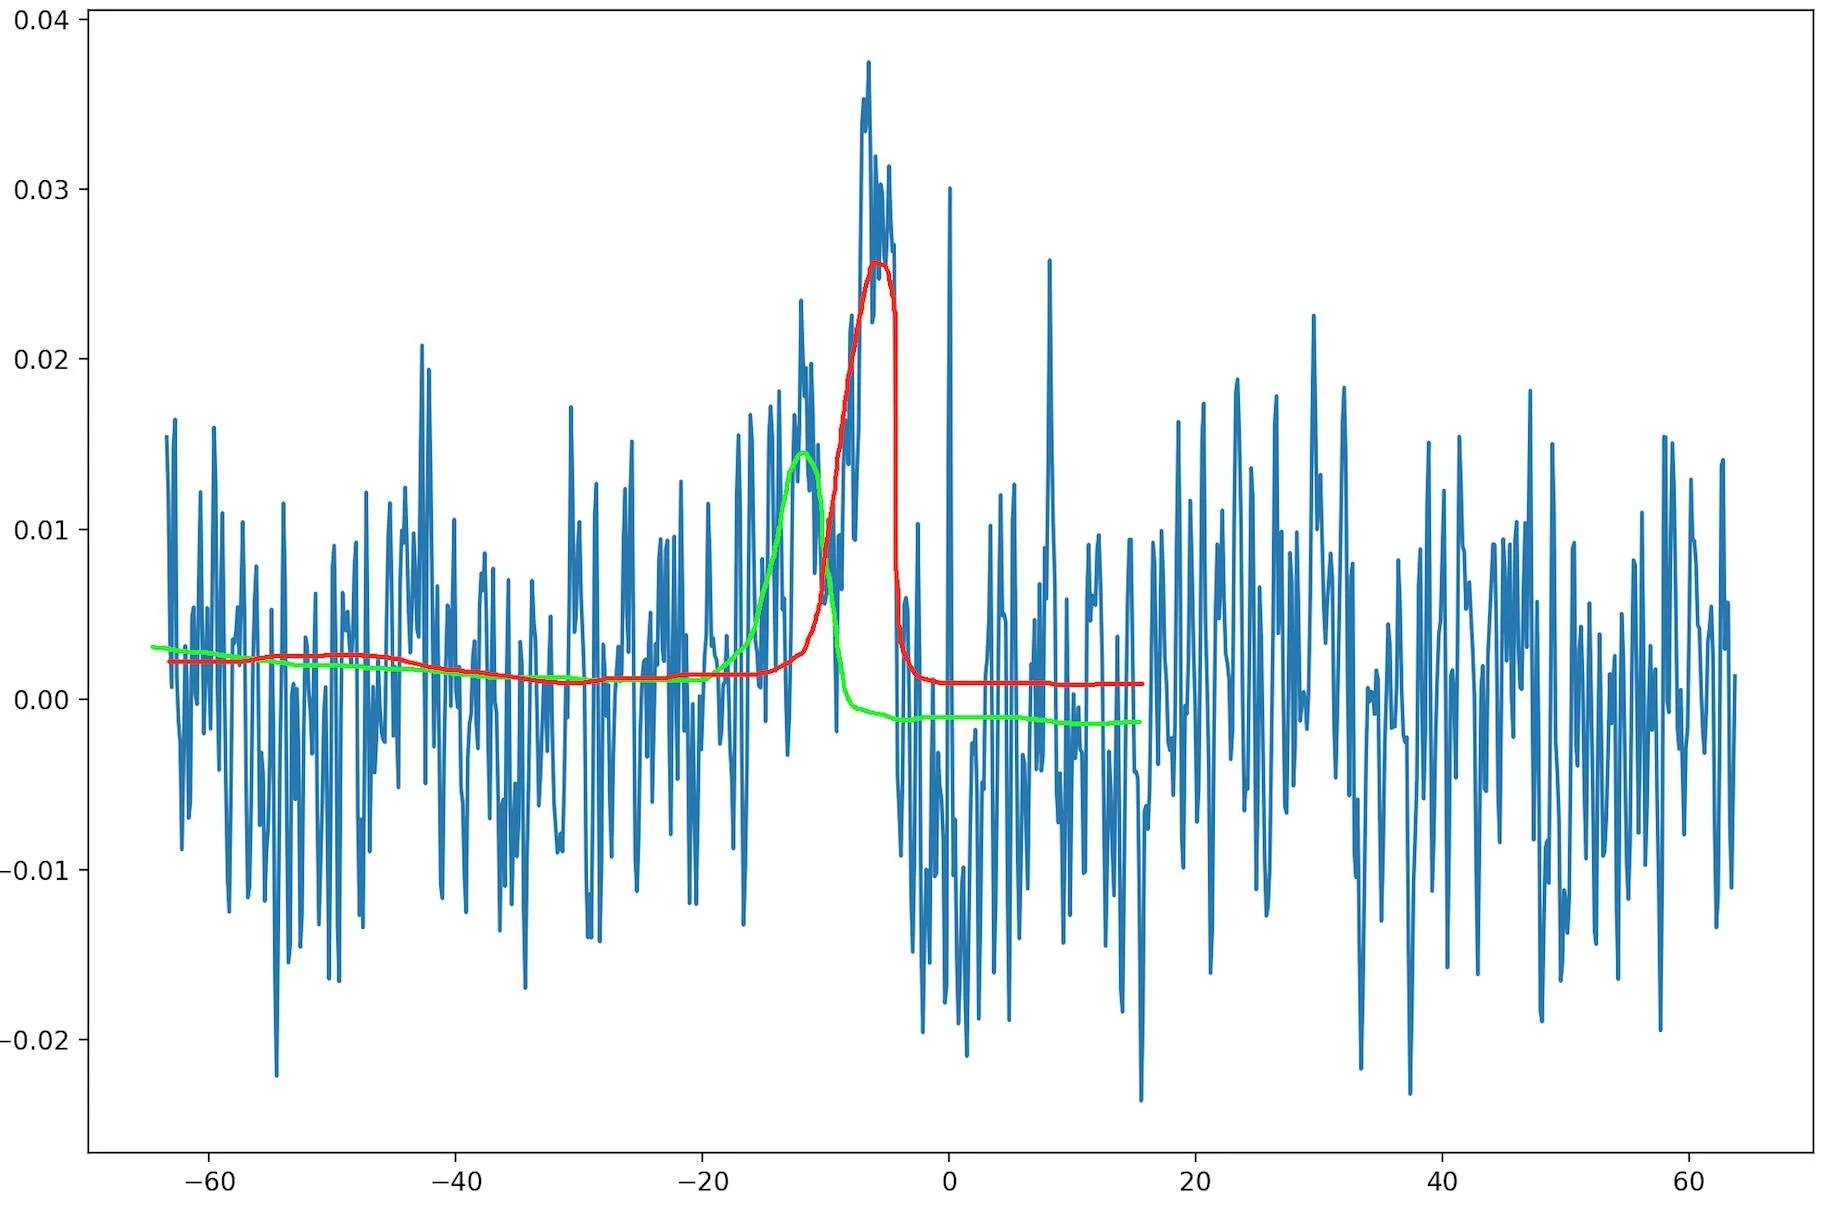
在Python的sklearn中使用高斯混合模型处理一维数组
7
- user40551
2
一个一维高斯混合模型的例子可以在这里找到:https://www.astroml.org/book_figures/chapter4/fig_GMM_1D.html - DrM
下面发布的解决方案需要您知道有多少个高斯分布存在,并且通常需要对参数进行合理的初始猜测。而且,在您提出的问题示例中,它很容易变得不稳定。例如,在您的数据中,为什么不是三个或四个高斯分布?其中任意两个都可能形成拟合问题的局部最小值。因此,所提出的问题是一个好问题,聚类是解决该问题的一种已建立的方法。 - DrM
1个回答
5
使用高斯曲线拟合一组点与使用GMM对数据建模的概率分布是不同的。当您使用GMM时,您在做后者,而这并不起作用。
如果您仅使用Y轴上的变量应用GMM,则会得到一个Y的高斯分布,它不考虑X变量。
如果您使用2个变量应用GMM,则会得到二元高斯分布,对于您的问题没有任何帮助。
现在,如果您想要拟合高斯曲线,请尝试此问题的答案。
如果您仅使用Y轴上的变量应用GMM,则会得到一个Y的高斯分布,它不考虑X变量。
如果您使用2个变量应用GMM,则会得到二元高斯分布,对于您的问题没有任何帮助。
现在,如果您想要拟合高斯曲线,请尝试此问题的答案。
import numpy
from scipy.optimize import curve_fit
import matplotlib.pyplot as plt

# Define some test data which is close to Gaussian
data = numpy.random.normal(size=10000)

hist, bin_edges = numpy.histogram(data, density=True)
bin_centres = (bin_edges[:-1] + bin_edges[1:])/2

# Define model function to be used to fit to the data above:
# Adapt it to as many gaussians you may want
# by copying the function with different A2,mu2,sigma2 parameters
def gauss(x, *p):
    A, mu, sigma = p
    return A*numpy.exp(-(x-mu)**2/(2.*sigma**2))

# p0 is the initial guess for the fitting coefficients (A, mu and sigma above)
p0 = [1., 0., 1.]

coeff, var_matrix = curve_fit(gauss, bin_centres, hist, p0=p0)

# Get the fitted curve
hist_fit = gauss(bin_centres, *coeff)

plt.plot(bin_centres, hist, label='Test data')
plt.plot(bin_centres, hist_fit, label='Fitted data')

# Finally, lets get the fitting parameters, i.e. the mean and standard deviation:
print 'Fitted mean = ', coeff[1]
print 'Fitted standard deviation = ', coeff[2]

plt.show()
如何适应多个高斯分布的代码更新:
def gauss2(x, *p):
    A1, mu1, sigma1, A2, mu2, sigma2 = p
    return A1*numpy.exp(-(x-mu1)**2/(2.*sigma1**2)) + A2*numpy.exp(-(x-mu2)**2/(2.*sigma2**2))

# p0 is the initial guess for the fitting coefficients initialize them differently so the optimization algorithm works better
p0 = [1., -1., 1.,1., -1., 1.]

#optimize and in the end you will have 6 coeff (3 for each gaussian)
coeff, var_matrix = curve_fit(gauss, X_data, y_data, p0=p0)

#you can plot each gaussian separately using
pg1 = coeff[0:3]
pg2 = coeff[3:]

g1 = gauss(X_data, *pg1)
g2 = gauss(X_data, *pg2)

plt.plot(X_data, y_data, label='Data')
plt.plot(X_data, g1, label='Gaussian1')
plt.plot(X_data, g2, label='Gaussian2')
- Gabriel M
4
是的,我看到了那个区别。我已经能够通过曲线拟合来获取其中一个峰值。但我还没有想出如何使用曲线拟合来获取多个不同的高斯函数。你在这里说的是:
“#定义要用于拟合上述数据的模型函数:
#通过使用不同的A2、mu2、sigma2参数复制该函数来适应您可能需要的许多高斯函数”
这意味着我要写类似于def gauss2的东西,带有A2、mu2、sigma2,并在同一张图上同时调用gauss和gauss2吗?我理解它们都会返回红色曲线而不是绿色曲线。 - user40551
修改了代码以处理两个高斯分布,展示如何检索它们并绘制它们。 - Gabriel M
@user40551和GabrielM,这是一个简单的情况,我们知道有多少个高斯分布存在并可以猜测初始参数。即使对于两个高斯分布,它也很容易不稳定。我很想看到一些响应所提出问题的东西,即使用聚类来确定高斯分布的数量和初始猜测。这是一个非常好的问题。 - DrM
@user40551 和 GabrielM,一个一维高斯混合模型的例子可以在这里找到:https://www.astroml.org/book_figures/chapter4/fig_GMM_1D.html - DrM
网页内容由stack overflow 提供, 点击上面的可以查看英文原文,
原文链接
原文链接
