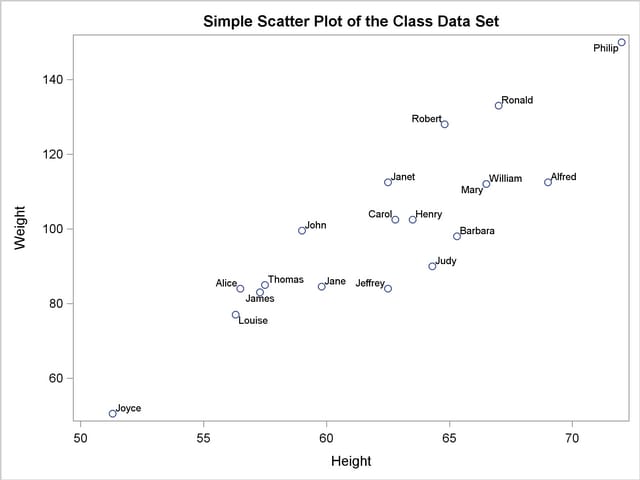
我希望能在Gadfly中绘制一个带标签的散点图,如下所示: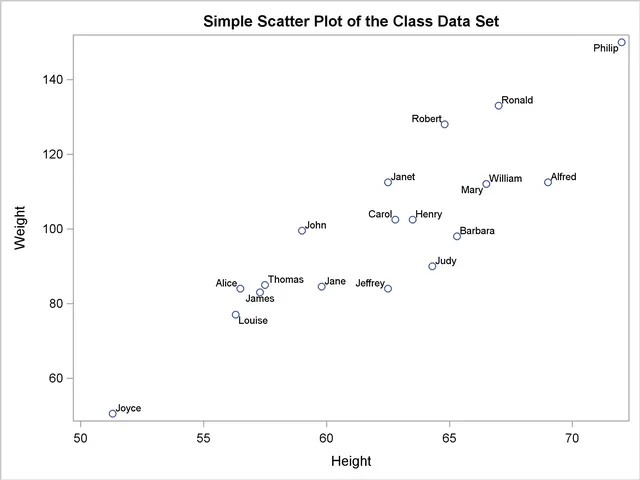 (来源: http://support.sas.com/documentation/cdl/en/statug/63033/HTML/default/images/renda.png)。请问如何实现呢?散点图很容易:
(来源: http://support.sas.com/documentation/cdl/en/statug/63033/HTML/default/images/renda.png)。请问如何实现呢?散点图很容易:using Gadfly
X = [1, 2, 2, 3, 3, 3, 4]
Y = [4, 4, 7, 7, 9, 1, 8]
Labels = ["bill", "susan", "megan", "eric", "fran", "alex", "fred"]
plot(x=X, y=Y)
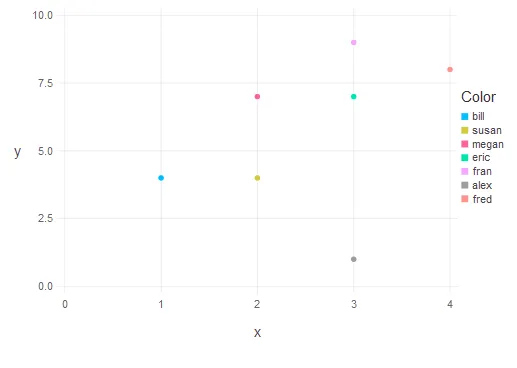
一种选择是使用颜色,但这并不好,因为图例会变得很大(尤其在比这个更复杂的示例中)。
plot(x=X,y=Y, color=Labels)