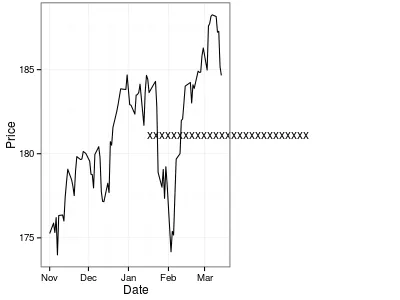
我正在尝试在一个日期为X轴的ggplot图表的右侧添加一些文本,但是我在设置注释注解(annotation_custom)中的xmin和xmax参数时遇到了问题,因为这是一个日期对象。我需要一些帮助。
library(ggplot2)
library(quantmod)
getSymbols("SPY", from="2013-11-01", to=Sys.Date())

SPY = data.frame(SPY)
SPY$Date = as.Date(rownames(SPY))
colnames(SPY)[6] = 'Price'
tail(SPY)

gg1 <- ggplot(data=SPY, aes(x=Date, y=Price)) + geom_line() + theme_bw()
gg1 <- gg1+ theme(plot.margin = unit(c(0.1,6,0.1,0.1), "cm"))
gg1

Text1 = textGrob("xxxxxxxxxxxxxxxxxxxxxxxxxxx")
Text1

ymax1 <- max((SPY)[6])
ymin1 <- min((SPY)[6])
xmin1 <- tail(SPY$Date,1)
xmax1 <- tail(SPY$Date,1)+10

gg1 <- gg1 + annotation_custom(grob = Text1,
               xmin = xmin1, xmax = xmax1, ymin = ymin1, ymax = ymax1)
gg1 <- ggplot_gtable(ggplot_build(gg1))
gg1$layout$clip[gg1$layout$name=="panel"] <- "off"
grid.draw(gg1)


Error in Ops.Date((x - from[1]), diff(from)) :
  / not defined for "Date" objects

Error in UseMethod("grid.draw") :
  no applicable method for 'grid.draw' applied to an object of class "c('gg', 'ggplot')"