使用rpart的决策树进行数据预测

10
我正在使用 R 对包含以下数据结构的数据帧“d”进行分类:
initial dataset 
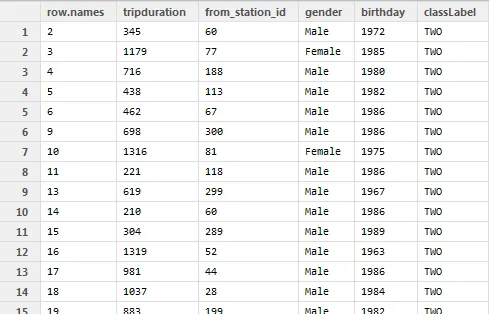
数据有 576666 行,“classLabel”列具有 3 级因子:ONE、TWO、THREE。
我正在使用 rpart 制作决策树。
fitTree = rpart(d$classLabel ~ d$tripduration + d$from_station_id + d$gender +  d$birthday)

我希望能够预测newdata中的"classLabel"值:

newdata = data.frame( tripduration=c(345,244,543,311), 
                      from_station_id=c(60,28,100,56),
                      gender=c("Male","Female","Male","Male"),  
                      birthday=c(1972,1955,1964,1967) )

 p <- predict(fitTree, newdata)
我希望我的结果是一个矩阵,其中每一行都有 
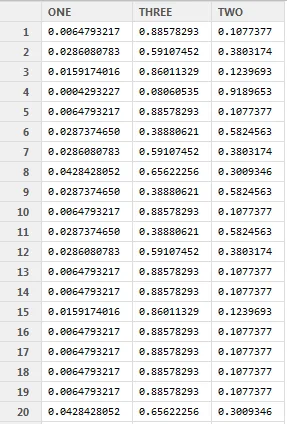
newdata 可能的 "classLabel" 三个值的概率。但是我得到的 p 结果是一个包含 576666 行的数据框,就像下面这样:

enter image description here

运行 predict 函数时还会收到以下警告:
Warning message:
'newdata' had 4 rows but variables found have 576666 rows 

我到底做错了什么?!


4
在你的公式中不要使用 $,而是使用 rpart(classLabel ~ tripduration + from_station_id + gender + birthday, data=d),否则变量将与数据框"d"绑定,不能在新数据框内解析。未来,请确保包含一个可重现的示例(https://dev59.com/eG025IYBdhLWcg3whGSx)和输入样本数据,以便我们能够获得与你相同的错误(数据的图像不算)。 - MrFlick
1个回答

18

我认为问题在于:你应该在预测代码中添加"type='class'":

    predict(fitTree,newdata,type="class")

尝试以下代码。在此示例中,我使用“鸢尾花”数据集。

    > data(iris)
    > head(iris)
    Sepal.Length Sepal.Width Petal.Length Petal.Width Species
  1          5.1         3.5          1.4         0.2  setosa
  2          4.9         3.0          1.4         0.2  setosa
  3          4.7         3.2          1.3         0.2  setosa
  4          4.6         3.1          1.5         0.2  setosa
  5          5.0         3.6          1.4         0.2  setosa
  6          5.4         3.9          1.7         0.4  setosa

  # model fitting
  > fitTree<-rpart(Species~Sepal.Length+Sepal.Width+Petal.Length+Petal.Width,iris)

  #prediction-one row data
  > newdata<-data.frame(Sepal.Length=7,Sepal.Width=4,Petal.Length=6,Petal.Width=2)
  > newdata
  Sepal.Length Sepal.Width Petal.Length Petal.Width
  1            7           4            6           2

 # perform prediction
  > predict(fitTree, newdata,type="class")
     1 
  virginica 
  Levels: setosa versicolor virginica

 #prediction-multiple-row data
 > newdata2<-data.frame(Sepal.Length=c(7,8,6,5),
 +                      Sepal.Width=c(4,3,2,4),
 +                      Petal.Length=c(6,3.4,5.6,6.3),
 +                      Petal.Width=c(2,3,4,2.3))

 > newdata2
  Sepal.Length Sepal.Width Petal.Length Petal.Width
   1            7           4          6.0         2.0
   2            8           3          3.4         3.0
   3            6           2          5.6         4.0
   4            5           4          6.3         2.3

# perform prediction
> predict(fitTree,newdata2,type="class")
      1         2         3         4 
 virginica virginica virginica virginica 
 Levels: setosa versicolor virginica

网页内容由stack overflow 提供, 点击上面的
可以查看英文原文,
原文链接