R plotly - 桑基图未返回

3

我在RStudio中运行以下代码,想要使用plotly创建桑基图。代码无误但是桑基图未显示,这是怎么回事?

library("plotly")
a = read.csv('cleanSankey.csv', header=TRUE, sep=',')
node_names <- unique(c(as.character(a$source), as.character(a$target)))
nodes <- data.frame(name = node_names)
links <- data.frame(source = match(a$source, node_names) - 1,
                    target = match(a$target, node_names) - 1,
                    value = a$value)

nodes_with_position <- data.frame(
  "id" = names,
  "label" = node_names,
  "x" = c(0, 0.1, 0.2, 0.3,0.4,0.5,0.6,0.7),
  "y" = c(0, 0.1, 0.2, 0.3, 0.4, 0.5, 0.6, 0.7)
)

#Plot
plot_ly(type='sankey',
        orientation = "h",
        
        node = list(
          label = node_names,
          x = nodes_with_position$x,
          y = nodes_with_position$y,
          color = "grey",
          pad = 15,
          thinkness = 20,
          line = list(color = "grey", width = 0.5)),
 
         link = list(
           source = links$source,
           target = links$target,
           value = links$value))

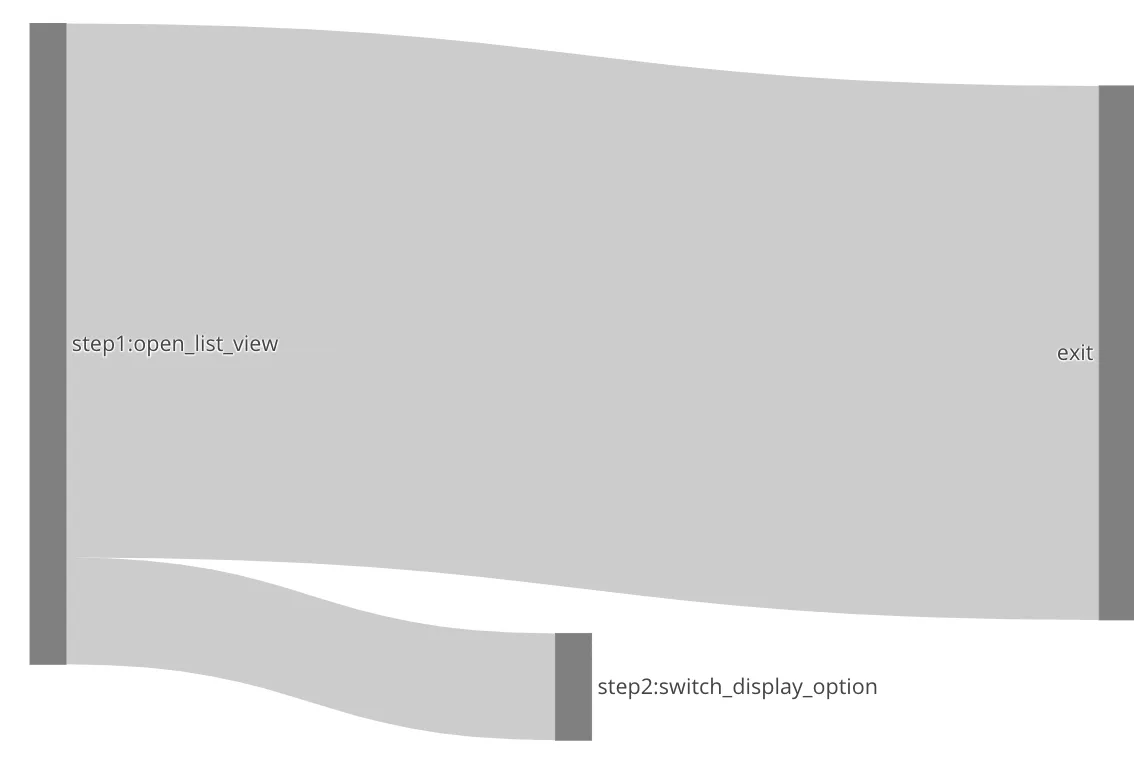
sankey图绘制完成,但第二层的节点指向了最后一层。如何修正节点位置?

1个回答

0

您需要通过设置arrangement参数来定义节点位置,以防止Plotly自动调整位置。

这需要一些技巧,因为您需要指定节点的坐标。您可以在此处找到更多详细信息:https://plotly.com/python/sankey-diagram/#define-node-position

代码

library(plotly)

a <- read.csv("~/cleanSankey.csv")

node_names <- unique(c(as.character(a$source), as.character(a$target)))

# added id column for clarity, but it's likely not needed
nodes <- data.frame(
  id = 0:(length(node_names)-1),
  name = node_names
)

links <- data.frame(
  source = match(a$source, node_names) - 1,
  target = match(a$target, node_names) - 1,
  value = a$value
)

# set the coordinates of the nodes
nodes$x <- c(0, 1, 0.5)
nodes$y <- c(0, 0.5, 1)

# plot - note the `arrangement="snap"` argument
plot_ly(
  type='sankey',
  orientation = "h",
  arrangement="snap", # can also change this to 'fixed'
  node = list(
    label = nodes$name,
    x = nodes$x,
    y = nodes$y,
    color = "grey",
    pad = 15,
    thinkness = 20,
    line = list(color = "grey", width = 0.5)
  ),
  link = list(
    source = links$source,
    target = links$target,
    value = links$value
  )
)

使用arrangement="snap"来绘制输出图:

Sankey plot with arrangement set to "snap"


我认为你只需要在 plot_ly 函数中添加 arrangement="snap"。如果这不起作用,请尝试 arrangement="fixed" - Cameron Raynor
我在桑基图中有8个层/列。根据您的建议,我得到了错误“Error in as.data.frame.default(x[[i]], optional = TRUE) : cannot coerce class ‘"function"’ to a data.frame”。代码已在帖子中更新。 - peace
尝试添加排列参数,但仍然失败。错误仍然是Error in as.data.frame.default(x[[i]], optional = TRUE) : cannot coerce class ‘"function"’ to a data.frame。 - peace
明白了,我会看看能否使用CSV样本进行复现。 - Cameron Raynor
我会用新代码更新我的答案。 - Cameron Raynor
显示剩余5条评论

网页内容由stack overflow 提供, 点击上面的
可以查看英文原文,
原文链接