在R中绘制二元变量的图形

3
我想绘制一个简单的图形。我有一个数据集,其中有n行和k列,每一行都有一个由0和1组成的序列。我想为所有行精确地绘制这个序列。
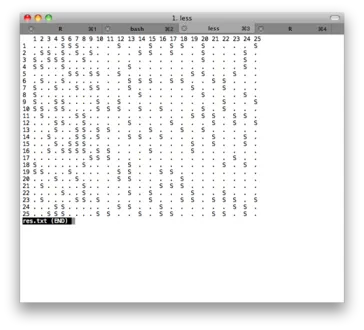
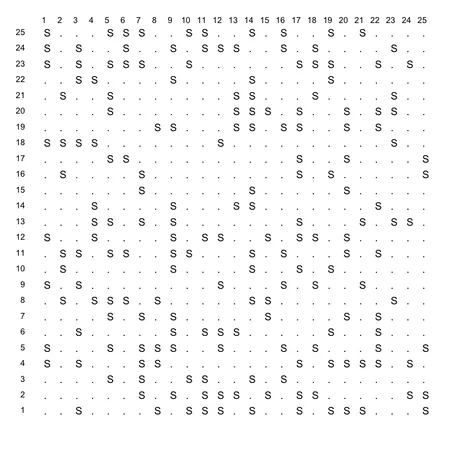
实际上,我想复制Gelman和Hill的书(《回归和多级/分层模型数据分析》)第24.1页,第516页的图表。我怀疑他用Latex制作了这个图形,但我似乎很荒谬,无法在R中复制这个简单的图形。该图形类似于此图。从链接中可以看出,“1”的位置被“S”替换,“0”的位置被“.”替换。这是一个简单的图形,但它显示了每个个体随时间的响应。

1
你能不能把1替换成S,0替换成.,然后打印数据框呢? - Brandon Bertelsen
是的。但是在 R 控制台上打印,然后只需复制并粘贴到文本编辑器中?这听起来不像是一个好方法,但也许我错了。 - Manoel Galdino
3个回答

4
我建议使用sprintf来输出格式化文本,这样更加简洁明了。如果你仍然需要绘图,可以采用以下方法:
给定包含数据的矩阵tbl
tbl <- matrix(data=rep(0:1,25), nrow=5)

您可以按以下方式生成图表:
plot(1, 1, xlim=c(1,dim(tbl)[2]+.5), ylim=c(0.5,dim(tbl)[1]), type="n")
lapply(1:dim(tbl)[1], function(x) {
  text(x=c(1:dim(tbl)[2]), y=rep(x,dim(tbl)[2]), labels=tbl[x,])
})

以此为基础,您可以调整文本和绘制参数来按照您的意愿美化图表。


3

以下是两种可能的解决方案,基于使用此辅助函数生成的虚假数据:

generate.data <- function(rate=.3, dim=c(25,25)) {
  tmp <- rep(".", prod(dim))
  tmp[sample(1:prod(dim), ceiling(prod(dim)*rate))] <- "S"
  m <- matrix(tmp, nr=dim[1], nc=dim[2])
  return(m)
}
  1. Text-based output

    x <- generate.data()
    rownames(x) <- colnames(x) <- 1:25
    capture.output(as.table(x), file="res.txt")
    

    The file res.txt include a pretty-printed version of the console output; you can convert it to pdf using any txt to pdf converter (I use the one from PDFlib). Here is a screenshot of the text file:

    enter image description here

  2. Image-based output

    First, here is the plotting function I used:

    make.table <- function(x, labels=NULL) {
      # x = matrix
      # labels = list of labels for x and y
      coord.xy <- expand.grid(x=1:nrow(x), y=1:ncol(x))
      opar <- par(mar=rep(1,4), las=1)
      plot.new() 
      plot.window(xlim=c(0, ncol(x)), ylim=c(0, nrow(x)))
      text(coord.xy$x, coord.xy$y, c(x), adj=c(0,1)) 
      if (!is.null(labels)) {
        mtext(labels[[1]], side=3, line=-1, at=seq(1, ncol(x)), cex=.8)
        mtext(labels[[2]], side=2, line=-1, at=seq(1, nrow(x)), cex=.8, padj=1)
      }
      par(opar)
    }
    

    Then I call it as

    make.table(x, list(1:25, 1:25))
    

    and here is the result (save it as png, pdf, jpg, or whatever).

    enter image description here


好的!谢谢大家。我会尝试所有的想法,看哪个更符合我的兴趣,然后选择其中一个答案。 - Manoel Galdino

2
据我所见,这是一个文本表格。我想知道你为什么要把它变成图形?无论如何,快速解决方案有以下两种:
  1. 制作文本表格(通过编程或打字),并将其截屏后嵌入到图中。

  2. 通过编程R语言的“text”函数,在空白图中放置文本。有关“text”的更多信息,请参阅http://cran.r-project.org/doc/contrib/Lemon-kickstart/kr_adtxt.html


除了截屏文本表格外,还可以使用 gplots::textplot 函数。 - Karsten W.
嗨,我知道这是一个文本表格(因此我猜他使用了Latex)。但是我有自己的数据框架,不想将其转换为文本表格并放入Word编辑器中(这就是我正在使用的)。也许我在这里错了,即使使用MS Word也更容易生成文本表格。当然,对于此方面的任何建议都非常感激。无论如何,谢谢。 - Manoel Galdino

网页内容由stack overflow 提供, 点击上面的
可以查看英文原文,
原文链接