我希望在MATLAB中创建一个简单的log(x)图表,其中模型随时间移动沿曲线移动。
总体目标是在两个图表并排显示,并对它们应用算法。我不确定从何处开始。
我在MATLAB编码方面相对较新,所以任何帮助都将非常有用!
谢谢 卢克
clf)不同,我们只需更新点的位置即可:%# control animation speed
DELAY = 0.01;
numPoints = 600;
%# create data
x = linspace(0,10,numPoints);
y = log(x);
%# plot graph
figure('DoubleBuffer','on') %# no flickering
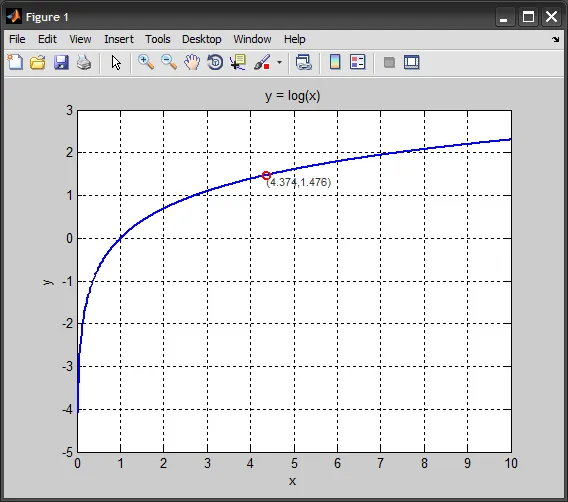
plot(x,y, 'LineWidth',2), grid on
xlabel('x'), ylabel('y'), title('y = log(x)')
%# create moving point + coords text
hLine = line('XData',x(1), 'YData',y(1), 'Color','r', ...
'Marker','o', 'MarkerSize',6, 'LineWidth',2);
hTxt = text(x(1), y(1), sprintf('(%.3f,%.3f)',x(1),y(1)), ...
'Color',[0.2 0.2 0.2], 'FontSize',8, ...
'HorizontalAlignment','left', 'VerticalAlignment','top');
%# infinite loop
i = 1; %# index
while true
%# update point & text
set(hLine, 'XData',x(i), 'YData',y(i))
set(hTxt, 'Position',[x(i) y(i)], ...
'String',sprintf('(%.3f,%.3f)',[x(i) y(i)]))
drawnow %# force refresh
%#pause(DELAY) %# slow down animation
i = rem(i+1,numPoints)+1; %# circular increment
if ~ishandle(hLine), break; end %# in case you close the figure
end
x = 1:100;
y = log(x);
comet(x,y)
x = 1:100;
y = log(x);
plot(x,y,'r')
hold on %# to keep the previous plot
comet(x,y,0) %# 0 hides the green tail
x = 1:100;
y = log(x);
DELAY = 0.05;
for i = 1:numel(x)
    clf;
    plot(x,y);
    hold on;
    plot(x(i),y(i),'r*');
    pause(DELAY);
end
x=1:100;
y=log(x);
figure
plot(x,y);
hold on; % hold on so that the figure is not cleared
h=plot(x(1),y(1),'r*'); % plot the first point
DELAY=.05;


for i=1:length(x)
    set(h,'xdata',x(i),'ydata',y(i)); % move the point using set
                                      % to change the cooridinates.
    M(i)=getframe(gcf);
    pause(DELAY)
end

%% Play the movie back

% create figure and axes for playback
figure
hh=axes;
set(hh,'units','normalized','pos',[0 0 1 1]);
axis off

movie(M) % play the movie created in the first part
解决方案可以这样
x = .01:.01:3;
comet(x,log(x))