在保存图形到 .png 格式前,我希望能给一些最重要的图形加上边框以突出显示。有没有办法在轴绘图区域之外绘制一个矩形?
我希望边框能够延伸到整个图形,包括图形标题和轴标签。
在保存图形到 .png 格式前,我希望能给一些最重要的图形加上边框以突出显示。有没有办法在轴绘图区域之外绘制一个矩形?
我希望边框能够延伸到整个图形,包括图形标题和轴标签。
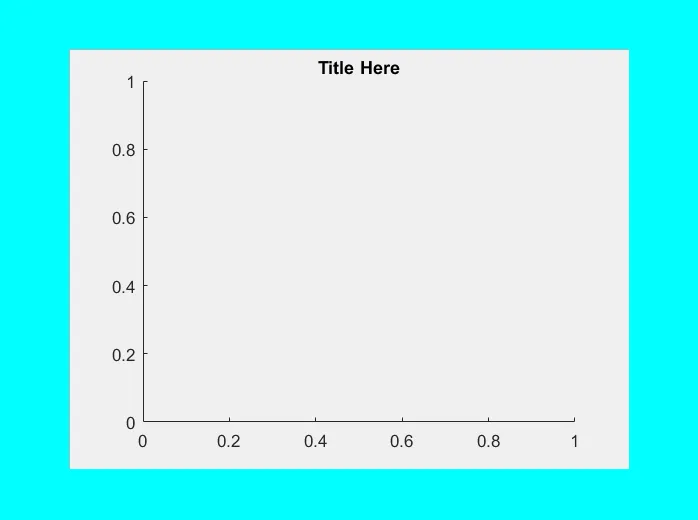
uipanel中并调整面板位置、边缘设计、图形颜色和面板颜色来创建各种边框类型。例如,这会创建一个宽的青色边框,带有一个向内倾斜的边缘,从面板边缘延伸到图形边缘:hFigure = figure('Color', 'c'); % Make a figure with a cyan background
hPanel = uipanel(hFigure, 'Units', 'normalized', ...
'Position', [0.1 0.1 0.8 0.8], ...
'BorderType', 'BeveledIn'); % Make a panel with beveled-in borders
hAxes = axes(hPanel, 'Color', 'none'); % Set the axes background color to none
title('Title Here');
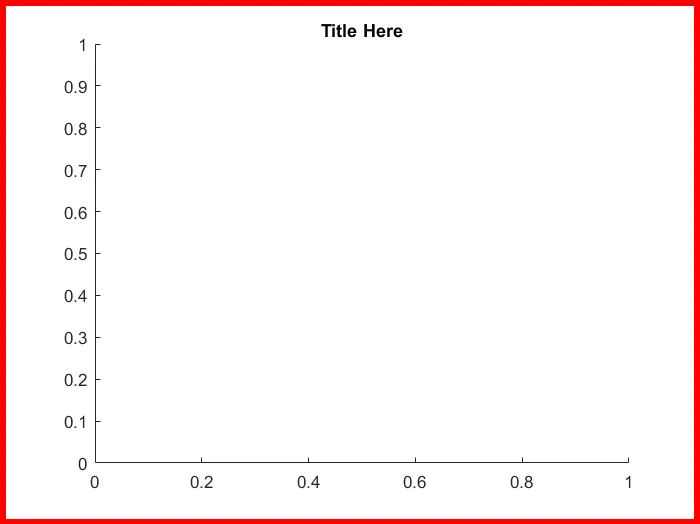
这将创建一个5像素宽的红色边框,紧贴着图像的边缘:
hFigure = figure();  % Make a figure
hPanel = uipanel(hFigure, 'Units', 'normalized', ...
                 'Position', [0 0 1 1], ...
                 'BorderType', 'line', ...
                 'BorderWidth', 5, ...
                 'BackgroundColor', 'w', ...
                 'HighlightColor', 'r');  % Make a white panel with red line borders
hAxes = axes(hPanel, 'Color', 'none');  % Set the axes background color to none
title('Title Here');
两个选项:
1- 将剪裁轴属性设置为'off',并在轴范围外绘制一个矩形。您需要使用轴的单位确定正确的位置。这可能有点具有挑战性,难以在不同的图表中保持一致。
2- 创建一个次要轴,使其不可见,将其大小调整为占据整个图形,并在其中绘制一个矩形:
f = figure
% One axes is invisible and contains a blue rectangle:
h = axes('parent',f,'position',[0,0,1,1],'visible','off')
set(h,'xlim',[0,1],'ylim',[0,1])
rectangle(h,'position',[0.01,0.01,0.98,0.98],'edgecolor',[0,0,0.5],'linewidth',3)
% Another axes is visible and you use as normal:
h = axes('parent',f)
plot(h,0:0.1:10,sin(0:0.1:10),'r-')
在这里,我明确使用了f和h作为“父”对象,因为通常会导致更健壮的代码,但您当然可以将它们省略,并依赖于隐式使用的gcf和gca在大多数情况下执行正确的操作。
img = imread('test_image.png');
fh = figure;
imshow(img,'border','tight')
hold on;
figurepos = get(gcf,'Position');
rectangle('Position',[4 4 figurepos(3)-7 figurepos(4)-7],'LineWidth',5,'EdgeColor','red')