我正在尝试找出如何在我的箱线图中添加观察数量。该软件包中的示例演示了如何在箱线图上添加观察数量,但我需要将观察数量写在x轴上。我将基于此创建一个可重现的示例。
# function for number of observations
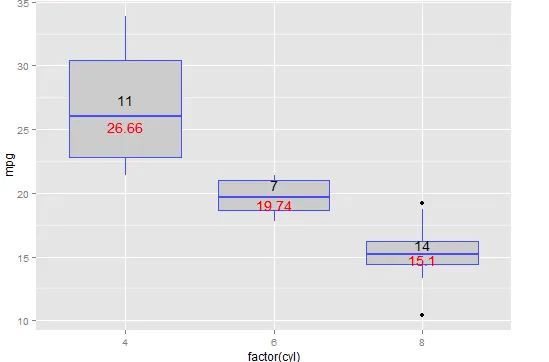
give.n <- function(x){
return(c(y = median(x)*1.05, label = length(x)))
# experiment with the multiplier to find the perfect position
}
# plot
ggplot(mtcars, aes(factor(cyl), mpg, label=rownames(mtcars))) +
geom_boxplot(fill = "grey80", colour = "#3366FF") +
stat_summary(fun.data = give.n, geom = "text", fun.y = median)