我正尝试在RMarkdown/Knitr中创建Beamer演示文稿幻灯片。在幻灯片中,我想将一个表格和一张图像并排放置,并在下方添加更多文字。当前,我的代码只能实现这个过程的一部分。我希望密度图能够放在Hmisc表格旁边。
我没有使用Kable或xtable,因为我通过Hmisc可以更好地控制表格。
此外,如何调整幻灯片中文本的特征(字体大小、类型、颜色)?
---
title: "BeamerTest1"
subtitle: Beamer Subtitle
author: "Author"
output:
beamer_presentation:
theme: CambridgeUS
colortheme: "beaver"
fonttheme: "structurebold"
---
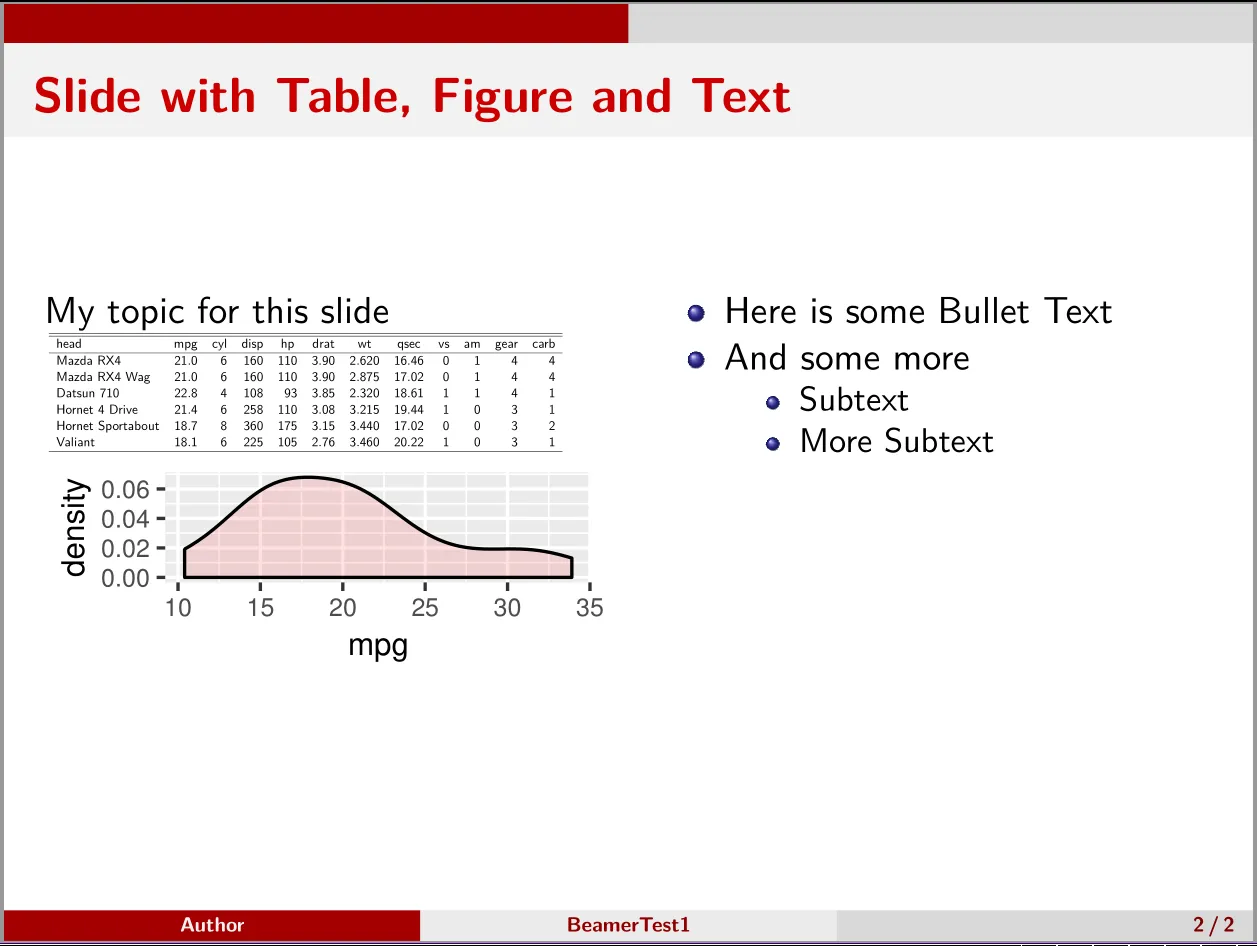
## Slide with Table, Figure and Text
My topic for this slide
\scalebox{0.35}{
```{r hmisc-table, echo=FALSE, message=FALSE, results='asis'}
library(Hmisc)
latex(head(mtcars), file='', table.env=FALSE, center='none')
```
}
```{r, echo=FALSE, fig.show='hold', fig.height=1, fig.width=2.5}
library(ggplot2)
mt <- ggplot(mtcars, aes(mpg)) + geom_density(alpha=.2, fill="#FF6666") +
theme(axis.title.x = element_text(size=10),axis.text.x = element_text(size=8),
axis.title.y = element_text(size=10),axis.text.y = element_text(size=8))
mt
```
- Here is some Bullet Text
- And some more
- Subtext
- More Subtext
谢谢