我使用seaborn中的factorplot绘制了数据,并获得了facetgrid对象,但仍然不明白如何在这样的图中设置以下属性:
- 图例大小:当我绘制大量变量时,图例非常小,字体也很小。
- y和x标签的字体大小(与上面类似的问题)
您可以通过调用 sns.set() 来放大字体。
import numpy as np
import matplotlib.pyplot as plt
import seaborn as sns
x = np.random.normal(size=37)
y = np.random.lognormal(size=37)
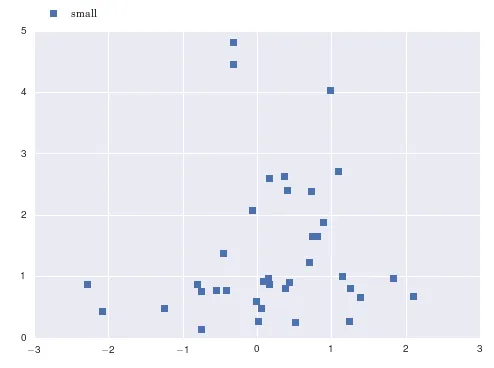
# defaults
sns.set()
fig, ax = plt.subplots()
ax.plot(x, y, marker='s', linestyle='none', label='small')
ax.legend(loc='upper left', bbox_to_anchor=(0, 1.1))
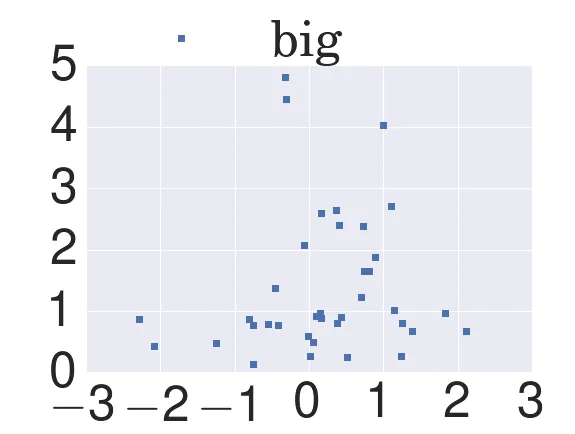
sns.set(font_scale=5)  # crazy big
fig, ax = plt.subplots()
ax.plot(x, y, marker='s', linestyle='none', label='big')
ax.legend(loc='upper left', bbox_to_anchor=(0, 1.3))
sns.set()时,某些更多的参数会在幕后悄悄地被改变。例如,绘图区域的背景颜色会被更改为 Seaborn 的默认值。@CookieMaster 也提到了类似的问题。 - SomJuraFacetGrid绘图会产生非常小的标签。虽然@paul-h已经描述了使用sns.set来改变字体比例的方法,但这可能不是最优解,因为它会改变所有绘图的font_scale设置。
您可以使用seaborn.plotting_context来仅更改当前绘图的设置:
with sns.plotting_context(font_scale=1.5):
    sns.factorplot(x, y ...)
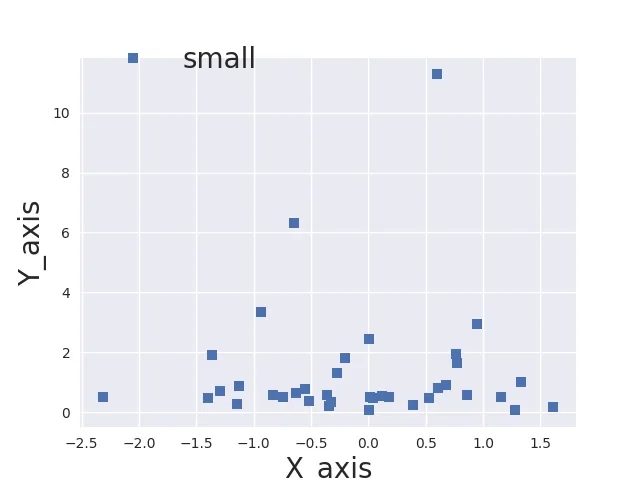
None,则font_scale被忽略,因此您需要使用plotting_context(“notebook”,font_scale = 5.5)或类似的内容。”(https://dev59.com/u43da4cB1Zd3GeqP5NR4#31865996) - Chris Warth我已经对@paul-H的代码进行了一些修改,这样你可以独立设置x/y轴和图例的字体大小:
import numpy as np
import matplotlib.pyplot as plt
import seaborn as sns
x = np.random.normal(size=37)
y = np.random.lognormal(size=37)

# defaults
sns.set()
fig, ax = plt.subplots()
ax.plot(x, y, marker='s', linestyle='none', label='small')
ax.legend(loc='upper left', fontsize=20,bbox_to_anchor=(0, 1.1))
ax.set_xlabel('X_axi',fontsize=20);
ax.set_ylabel('Y_axis',fontsize=20);

plt.show()
这是输出内容:
plt.setp(g._legend.get_title(), fontsize=20)
这对我有效
g = sns.catplot(x="X Axis", hue="Class", kind="count", legend=False, data=df, height=5, aspect=7/4)
g.ax.set_xlabel("",fontsize=30)
g.ax.set_ylabel("Count",fontsize=20)
g.ax.tick_params(labelsize=15)
没有奏效的是在g上直接调用set_xlabel,例如g.set_xlabel()(然后我会收到“Facetgrid没有set_xlabel”方法错误)
col_wrap将分面“包装”到多个行中,这可能会有所帮助。 - mwaskom