在R中使用geom_rect对时间序列进行阴影处理

28

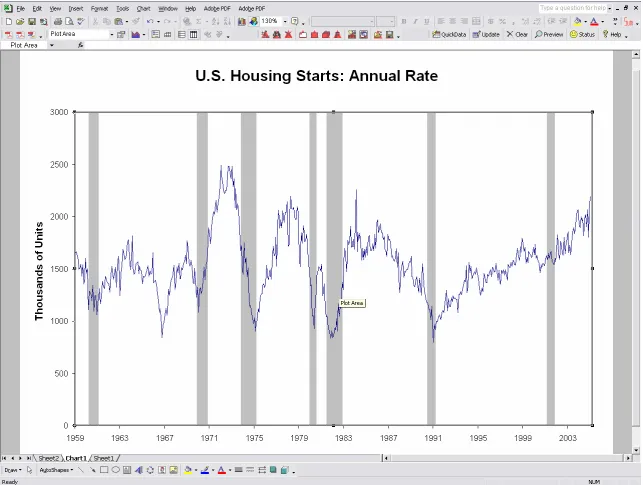
我正在尝试为时间序列图中的某个部分进行阴影处理(有点像经济衰退的阴影处理 - 类似于此excel文件中经济衰退阴影的图形底部的图表)。我制作了一个小示例来说明。 我首先创建了一个时间序列,用ggplot2绘制它,然后想使用geom_rect提供阴影效果。但是在参数方面可能会出错。

a<-rnorm(300)
a_ts<-ts(a, start=c(1910, 1), frequency=12)
a_time<-time(a_ts)
a_series<-ts.union(big=a_ts, month=a_time)
a_series_df<-as.data.frame(a_series)
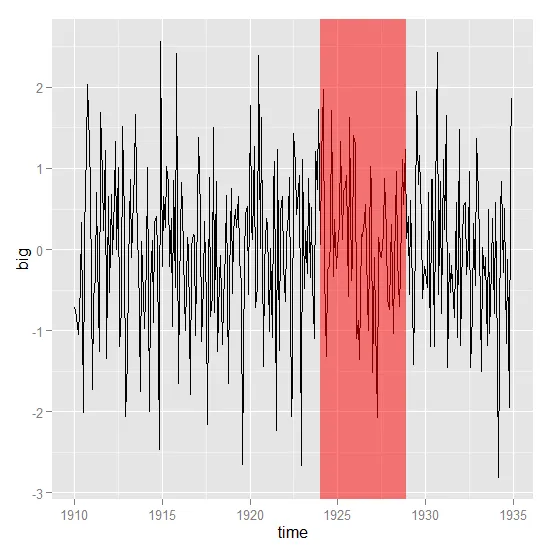
ggplot(a_series)+
  geom_line(mapping=aes_string(x="month", y="big"))+
  geom_rect(
    fill="red",alpha=0.5, 
    mapping=aes_string(x="month", y="big"), 
    xmin=as.numeric(as.Date(c("1924-01-01"))),
    xmax=as.numeric(as.Date(c("1928-12-31"))),
    ymin=0,
    ymax=2
    )

请注意,我也尝试了 which 命令,但它也没有起作用。

geom_rect(
        fill="red",alpha=0.5, 
        mapping=aes_string(x="month", y="big"), 
        aes(
           xmin=as.numeric(as.Date(c("1924-01-01"))),
           xmax=as.numeric(as.Date(c("1928-12-31"))),
           ymin=0,
           ymax=2)
        )

enter image description here

4个回答

24

使用annotate会更容易,同时请注意,矩形的边界可以如下所示指定:

ggplot(a_series_df, aes(month, big)) + 
    geom_line() +
    annotate("rect", fill = "red", alpha = 0.5, 
        xmin = 1924, xmax = 1928 + 11/12,
        ymin = -Inf, ymax = Inf) +
    xlab("time")

这也可以运行:

library(zoo)

z <- read.zoo(a_series_df, index = 2)
autoplot(z) + 
    annotate("rect", fill = "red", alpha = 0.5, 
        xmin = 1924, xmax = 1928 + 11/12,
        ymin = -Inf, ymax = Inf) + 
    xlab("time") +
    ylab("big")

任意一个都会给出这个:

在此输入图片描述


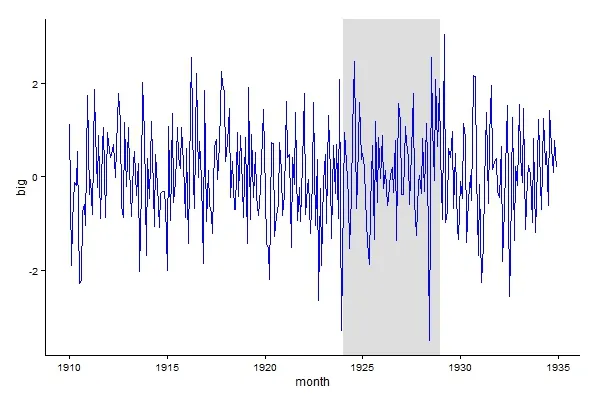
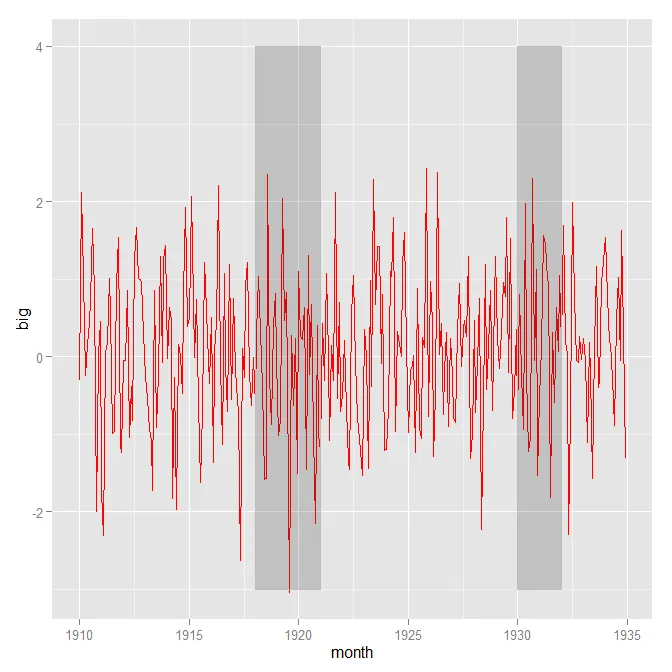
annotate("rect",...)函数是否接受边框参数?我找不到相关文档。我想要得到一个只有边框的红色矩形,没有填充。 - Urvah Shabbir
1
@urwaCFC,使用 col= 而不是 fill= - G. Grothendieck
我最终使用了4个 annotate("segment",...)。还是谢谢,我会在将来尝试使用它。 - Urvah Shabbir
这个答案的额外好处是适用于不具有显式 x 和 y 映射的不寻常的几何图形(例如 geom_errorbar())。 - Rich Pauloo
1
@Urvah,如果您使用多个注释的原因是为了获得多个阴影矩形,则请注意xmin和ymin可以是向量,从而可以使用单个注释语句。例如:library(ggplot2) ggplot(a_series_df, aes(month, big)) + geom_line() + annotate("rect", fill = "red", alpha = 0.5, xmin = c(1915, 1924), xmax = c(1920, 1928) + 11/12, ymin = -Inf, ymax = Inf) + xlab("time") - G. Grothendieck

21

代码运行正常,需要将xminxmax进行十进制日期转换,如下所示,需要使用lubridate包。

代码运行正常,需要将xminxmax进行十进制日期转换,如下所示,需要使用lubridate包。

library("lubridate")
library("ggplot2")

ggplot(a_series_df)+
  geom_line(mapping = aes_string(x = "month", y = "big")) +
  geom_rect(
    fill = "red", alpha = 0.5, 
    mapping = aes_string(x = "month", y = "big"), 
    xmin = decimal_date(as.Date(c("1924-01-01"))),
    xmax = decimal_date(as.Date(c("1928-12-31"))),
    ymin = 0,
    ymax = 2
  )

更清晰的版本,先绘制阴影以避免线条颜色改变。

ggplot() +
  geom_rect(data = data.frame(xmin = decimal_date(as.Date(c("1924-01-01"))),
                              xmax = decimal_date(as.Date(c("1928-12-31"))),
                              ymin = -Inf,
                              ymax = Inf),
            aes(xmin = xmin, xmax = xmax, ymin = ymin, ymax = ymax),
            fill = "grey", alpha = 0.5) +
  geom_line(data = a_series_df,aes(month, big), colour = "blue") +
  theme_classic()

在此输入图片描述


2
请注意,这是有效的因为aes()直接传递给了每个geom,而不是传递给ggplot()。如果您在ggplot()中提供aes(x=Date,...)并使用任何其他geom,则会出现奇怪的情况... - Jthorpe
@Jthorpe 这是关于绘图顺序的问题,我可以将 aes 放在 ggplot 中并绘制线条,然后再绘制矩形,但这样线条就会被矩形遮挡。当然,我们可以使用 alpha 来调整透明度。取决于个人偏好。 - zx8754
1
具体来说,如果您将aes()提供给ggplot(),则需要在传递给geom_rect()的数据中提供该调用中的所有变量,并且字段的类必须一致。将调用aes()移动到各个几何对象比在传递给geom_rect()的数据框中构造具有正确格式的所需变量要容易得多。 - Jthorpe

11
要使用 geom_rect,你需要通过 data.frame 定义你的矩形坐标。
shade = data.frame(x1=c(1918,1930), x2=c(1921,1932), y1=c(-3,-3), y2=c(4,4))

#    x1   x2 y1 y2
#1 1918 1921 -3  4
#2 1930 1932 -3  4

然后你把你的数据和阴影的data.frame提供给ggplot

ggplot() + 
  geom_line(aes(x=month, y=big), color='red',data=a_series_df)+
  geom_rect(data=shade, 
            mapping=aes(xmin=x1, xmax=x2, ymin=y1, ymax=y2), color='grey', alpha=0.2)

enter image description here


0
library(xts)
library(zoo)
library(ggts)

创建一个xts对象

data<-as.xts(x=runif(228,20,40),order.by = seq(as.Date("2000/01/01"), by = "month", length.out = 228))

创建日期数据框以便生成阴影

date<-data.frame(as.Date("2008-01-01"),as.Date("2009-01-01"))

现在创建带阴影区域的图表

plot_data<-ggts(data)+geom_cycle(date)

网页内容由stack overflow 提供, 点击上面的
可以查看英文原文,
原文链接