我在 R 中有一个名为 s 的向量,其中包含数值。我刚刚使用函数 fft(s) 计算了快速傅里叶变换。然后将这些值打印到图表中,如下:
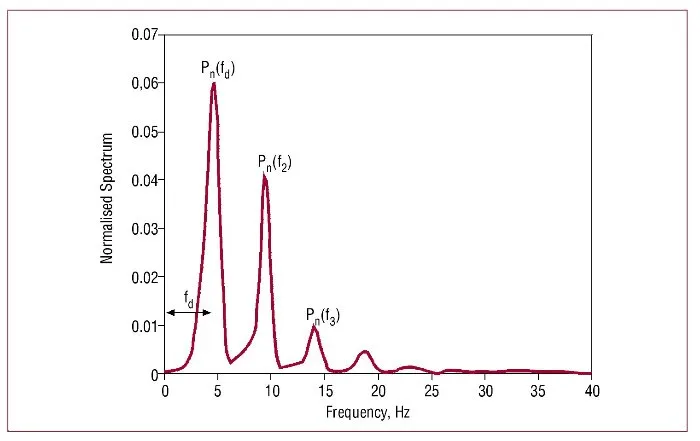
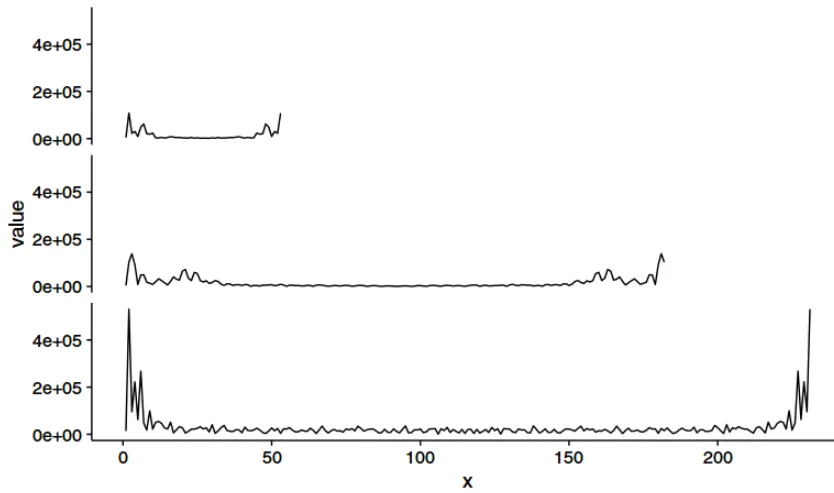 其中 x 是简单的 1, ... length(fft(s))。我看到这里有强烈的对称性——这是为什么?我原本期望像这样:
 我做错了什么?以下是第一个图表的 MWE:
其中 x 是简单的 1, ... length(fft(s))。我看到这里有强烈的对称性——这是为什么?我原本期望像这样:
我做错了什么?以下是第一个图表的 MWE:df <- structure(list(value = c(3, 1537.68157138987, 531.727745627154,
8.50387522397935, 5.40309722205537, 2.30232661295167, 0.420000953675226,
0, 0, 0, 0, 0, 0, 0, 0, 0, 0, 0, 0, 0, -4.73469069995451, -829.997919240523,
-3919.09161844073, -6460.79922752307, -6507.49592868557, -4849.27485532219,
-1674.36434175734, -83.1428571428571, -2.55813257187214, -261.182084182236,
-2915.2762208206, -5668.7235841082, -6990.36364128962, -6997.7273121356,
-6211.86050115633, -4378.77236521268, -1421.9056880109, -30.3635181412285,
-3.58181865471396, -2408.88296333223, -3106.95655095245, -6482.32762645408,
-6111.41765122797, -1821.04333977064, 0, 0, 0, 0, 0, 0, 0, 0,
0, 0, 0, 0, 0, 0, 0, 0, 0, 0, 0, 0, 0, 0, 0, 0, 0, 0, 0, 0, 0,
0, 0, 0, 0, 0, 0, 0, 0, 0, 0, 0, 0, 0, 0, 0, 0, 0, 0, 0, 0, 0,
0, 0, 0, 0, 0, 0, 0, 0, 0, 0, 0, 0, 0, 0, 0, 0, 0, 0, 0, 0, 0,
0, 0, 0, 0, 0, 0, 0, 0, 0, 0, 0, 0, 0, 0, 0, 0, 0, 0, 0, 0, 0,
0, 0, 0, 0, 0, 0, 0, 0, 0, 0, 0, 0, 0, 0, 0, 0, 0, 0, 0, 0, 0,
0, 0, 0, 41.499896933588, 998.907991416867, 3778.2752099702,
6543, 7005.95412518948, 6995.72726353206, 6293.82005765438, 3269.99904633924,
592.910420911179, 2, 1378.82116693398, 4391.17937491872, 6822.45459767001,
6220.908446583, 3447.42762806772, 581, 10.2727745627154, 873.056274992053,
3248.72737676457, 3776.64174236464, 3779.59937375451, 2711.30950879224
)), .Names = "value", row.names = c(NA, -182L), class = "data.frame")
fft_res <- fft(df$value)
ggplot(data.frame(x = 1:length(fft_res), value = Mod(fft_res)), aes(x,value)) + geom_line()
x=-0.5*length(fft_res):0.5*length(fft_res)吗?我以为fft(...)只返回正轴... - Make42