R ggplot2:如何更改分面条中字体和背景的颜色?

8
我正在尝试自定义一个包含分面的ggplot2图表,并希望更改分面条的颜色以及字体的颜色。我找到了一些代码来更改strip.background颜色,但无法修改它来同时更改字体颜色...有什么想法吗?
目前我得到的是:
library(ggplot2)
library(grid)

p <- ggplot(mpg, aes(displ, cty)) + geom_point() + facet_grid(drv ~ cyl) +
  ggtitle("How to change coloour of font in facet strip?")

g <- ggplot_gtable(ggplot_build(p))
strip_both <- which(grepl('strip-', g$layout$name))
fills <- c("red","green","blue","yellow","red","green","blue","yellow")
k <- 1

for (i in strip_both) {
  j <- which(grepl('rect', g$grobs[[i]]$grobs[[1]]$childrenOrder))
  g$grobs[[i]]$grobs[[1]]$children[[j]]$gp$fill <- fills[k]
  k <- k+1
}
grid.draw(g)

该文内容由 reprex package (v0.2.1) 于2018年11月23日创建

3个回答

7

当然,可能有更好的解决方案,但目前我只能做到这一步:

library(ggplot2)
library(grid)
library(RColorBrewer)

p <- ggplot(mpg, aes(x = displ, y = cty)) + 
  geom_point() + 
  facet_grid(drv ~ cyl) +
  ggtitle("How to change coloour of font in facet strip?") + 
  ggthemes::theme_few()

g <- ggplot_gtable(ggplot_build(p))

strips <- which(grepl('strip-', g$layout$name))

pal <- brewer.pal(8, "Paired")


for (i in seq_along(strips)) {
  k <- which(grepl('rect', g$grobs[[strips[i]]]$grobs[[1]]$childrenOrder))
  l <- which(grepl('titleGrob', g$grobs[[strips[i]]]$grobs[[1]]$childrenOrder))
  g$grobs[[strips[i]]]$grobs[[1]]$children[[k]]$gp$fill <- pal[i]
  g$grobs[[strips[i]]]$grobs[[1]]$children[[l]]$children[[1]]$gp$col <- pal[i + 1]
}

plot(g)

change text and strips colors


1
很好,颜色选择不错,谢谢!(我认为缺少调用library(ggthemes)的代码?) - Matifou
1
谢谢。抱歉,我忘记取消注释 ggthemes::theme_few(),我通常会尽力记住它。我希望 Hadley 不要听到这个,但我非常讨厌默认的 ggplot2 主题,从心底里讨厌。 - utubun

5
另一个选择是使用 grid 的编辑功能,前提是我们构建要编辑的每个 grob 的 gPath

准备 gPaths:

library(ggplot2)
library(grid)

p <- ggplot(mpg, aes(displ, cty)) + geom_point() + facet_grid(drv ~ cyl)

# Generate the ggplot2 plot grob
g <- grid.force(ggplotGrob(p))
# Get the names of grobs and their gPaths into a data.frame structure
grobs_df <- do.call(cbind.data.frame, grid.ls(g, print = FALSE))
# Build optimal gPaths that will be later used to identify grobs and edit them
grobs_df$gPath_full <- paste(grobs_df$gPath, grobs_df$name, sep = "::")
grobs_df$gPath_full <- gsub(pattern = "layout::", 
                            replacement = "", 
                            x = grobs_df$gPath_full, 
                            fixed = TRUE)

查看表格grobs_df并熟悉命名和路径。例如,所有条带都包含关键词“strip”。它们的背景由关键词“background”确定,标题文本由“titleGrob”和“text”确定。然后,我们可以使用正则表达式来捕获它们:

# Get the gPaths of the strip background grobs
strip_bg_gpath <- grobs_df$gPath_full[grepl(pattern = ".*strip\\.background.*", 
                                            x = grobs_df$gPath_full)]
strip_bg_gpath[1] # example of a gPath for strip background 
## [1] "strip-t-1.7-5-7-5::strip.1-1-1-1::strip.background.x..rect.5374"

# Get the gPaths of the strip titles
strip_txt_gpath <- grobs_df$gPath_full[grepl(pattern = "strip.*titleGrob.*text.*", 
                                             x = grobs_df$gPath_full)]
strip_txt_gpath[1] # example of a gPath for strip title
## [1] "strip-t-1.7-5-7-5::strip.1-1-1-1::GRID.titleGrob.5368::GRID.text.5364"

现在我们可以编辑grobs:
# Generate some color
n_cols <- length(strip_bg_gpath)
fills <- rainbow(n_cols)
txt_colors <- gray(0:n_cols/n_cols)

# Edit the grobs
for (i in 1:length(strip_bg_gpath)){
  g <- editGrob(grob = g, gPath = strip_bg_gpath[i], gp = gpar(fill = fills[i]))
  g <- editGrob(grob = g, gPath = strip_txt_gpath[i], gp = gpar(col = txt_colors[i]))
}

# Draw the edited plot
grid.newpage(); grid.draw(g)
# Save the edited plot
ggsave("edit_strips_bg_txt.png", g)

enter image description here


非常好的,非常详细和有指导性的答案,谢谢!(也许可以只是评论掉“ggsave”这行代码吗?复制粘贴的人可能会得到不想要的保存文件)。谢谢! - Matifou

2

虽然这个问题早已得到解答,但我已经封装了一个函数,可以根据以前的答案轻松设置单个图像的背景、边框和文本颜色。我发布它以便对其他人有所帮助。

library(dplyr)
library(ggplot2)
library(RColorBrewer)

这个函数:

modify_facet_appearance <- function(plot = NULL,
                                    strip.background.x.fill = NULL, 
                                    strip.background.y.fill = NULL,
                                    strip.background.x.col = NULL,
                                    strip.background.y.col = NULL,
                                    strip.text.x.col = NULL,
                                    strip.text.y.col = NULL){
  
  if(is.null(plot)){stop("A ggplot (gg class) needs to be provided!")}
  
  # Generate gtable object to modify the facet strips:
  g <- ggplot_gtable(ggplot_build(plot))
  
  # Get the locations of the right and top facets in g:
  stripy <- which(grepl('strip-r|strip-l', g$layout$name)) # account for when strip positions are switched r-l and/or t-b in facet_grid(switch = )
  stripx <- which(grepl('strip-t|strip-b', g$layout$name))
  
  # Check that the provided value arrays have the same length as strips the plot has:
  lx <- c(length(strip.background.x.fill), length(strip.background.x.col), length(strip.text.x.col))
  if(!all(lx==length(stripx) | lx==0)){stop("The provided vectors with values need to have the same length and the number of facets in the plot!")}
  ly <- c(length(strip.background.y.fill), length(strip.background.y.col), length(strip.text.y.col))
  if(!all(ly==length(stripy) | ly==0)){stop("The provided vectors with values need to have the same length and the number of facets in the plot!")}
  
  # Change the strips on the y axis:
  for (i in seq_along(stripy)){ # if no strips in the right, the loop will not be executed as seq_along(stripy) will be integer(0)
    
    # Change strip fill and (border) colour :
    j1 <- which(grepl('strip.background.y', g$grobs[[stripy[i]]]$grobs[[1]]$childrenOrder))
    if(!is.null(strip.background.y.fill[i])){g$grobs[[stripy[i]]]$grobs[[1]]$children[[j1]]$gp$fill <- strip.background.y.fill[i]} # fill
    if(!is.null(strip.background.y.col[i])){g$grobs[[stripy[i]]]$grobs[[1]]$children[[j1]]$gp$col <- strip.background.y.col[i]} # border colour
    
    # Change color of text:
    j2 <- which(grepl('strip.text.y', g$grobs[[stripy[i]]]$grobs[[1]]$childrenOrder))
    if(!is.null(strip.text.y.col[i])){g$grobs[[stripy[i]]]$grobs[[1]]$children[[j2]]$children[[1]]$gp$col <- strip.text.y.col[i]}

  }
  
  # Same but for the x axis:
  for (i in seq_along(stripx)){
    
    # Change strip fill and (border) colour :
    j1 <- which(grepl('strip.background.x', g$grobs[[stripx[i]]]$grobs[[1]]$childrenOrder))
    if(!is.null(strip.background.x.fill[i])){g$grobs[[stripx[i]]]$grobs[[1]]$children[[j1]]$gp$fill <- strip.background.x.fill[i]} # fill
    if(!is.null(strip.background.x.col[i])){g$grobs[[stripx[i]]]$grobs[[1]]$children[[j1]]$gp$col <- strip.background.x.col[i]} # border colour
    
    # Change color of text:
    j2 <- which(grepl('strip.text.x', g$grobs[[stripx[i]]]$grobs[[1]]$childrenOrder))
    if(!is.null(strip.text.x.col[i])){g$grobs[[stripx[i]]]$grobs[[1]]$children[[j2]]$children[[1]]$gp$col <- strip.text.x.col[i]}

  }
  
  return(g) 
  
  # Note that it returns a gtable object. This can be ploted with plot() or grid::draw.grid(). 
  # patchwork can handle the addition of such gtable to a layout with other ggplot objects, 
  # but be sure to use patchwork::wrap_ggplot_grob(g) for proper alignment of plots!
  # See: https://patchwork.data-imaginist.com/reference/wrap_ggplot_grob.html
  
}

示例:

该功能可以从gg对象中进行管道传输,有点类似于添加+主题()的方式。

pal.y <- brewer.pal(length(unique(mpg$drv))*2, "Paired")
pal.x <- brewer.pal(length(unique(mpg$cyl))*2, "Paired")

p <- {ggplot(mpg, aes(displ, cty)) + 
  geom_point() + 
  facet_grid(drv ~ cyl) +
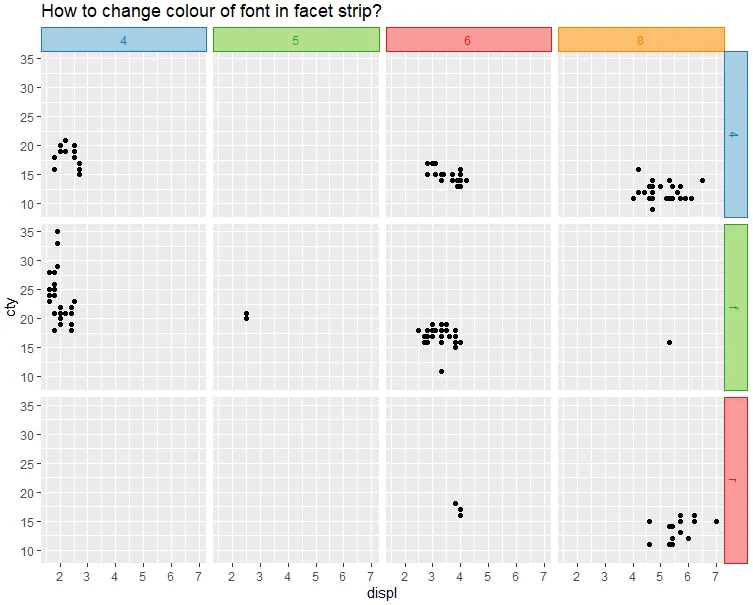
  ggtitle("How to change colour of font in facet strip?")} %>%
  modify_facet_appearance(strip.background.x.fill = pal.x[seq(1, length(pal.x), 2)],
                          strip.background.x.col = pal.x[seq(2, length(pal.x), 2)],
                          strip.text.x.col = pal.x[seq(2, length(pal.x), 2)],
                          strip.background.y.fill = pal.y[seq(1, length(pal.y), 2)],
                          strip.background.y.col = pal.y[seq(2, length(pal.y), 2)],
                          strip.text.y.col = pal.y[seq(2, length(pal.y), 2)])
plot(p)

enter image description here


网页内容由stack overflow 提供, 点击上面的
可以查看英文原文,
原文链接