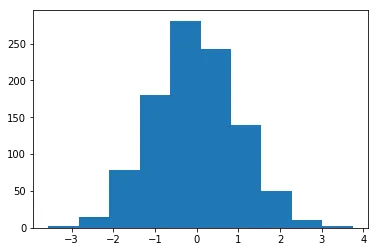
我有一个数组,想将其转换为百分位数。例如,假设我有一个正态分布的数组:
import numpy as np
import matplotlib.pyplot as plt

arr = np.random.normal(0, 1, 1000)
plt.hist(arr)
np.percentile函数,但这个函数返回的是给定数组和分位数的值,而我需要的是给定数组和值的分位数。
是否有相对高效的方法来实现这一点?
我有一个数组,想将其转换为百分位数。例如,假设我有一个正态分布的数组:
import numpy as np
import matplotlib.pyplot as plt
arr = np.random.normal(0, 1, 1000)
plt.hist(arr)
np.percentile函数,但这个函数返回的是给定数组和分位数的值,而我需要的是给定数组和值的分位数。
是否有相对高效的方法来实现这一点?
from scipy.stats import percentileofscore
import pandas as pd

# generate example data
arr = np.random.normal(0, 1, 10)

# pre-sort array
arr_sorted =  sorted(arr)

# calculate percentiles using scipy func percentileofscore on each array element
s = pd.Series(arr)
percentiles = s.apply(lambda x: percentileofscore(arr_sorted, x))
检查结果是否正确:
df = pd.DataFrame({'data': s, 'percentiles': percentiles})
df.sort_values(by='data')

       data   percentiles
3 -1.692881   10.0
8 -1.395427   20.0
7 -1.162031   30.0
6 -0.568550   40.0
9  0.047298   50.0
5  0.296661   60.0
0  0.534816   70.0
4  0.542267   80.0
1  0.584766   90.0
2  1.185000  100.0
有许多方式可以完成这个任务,具体取决于您想使用的库以及您拥有的数据类型。
import numpy as np
# Input data
arr  = np.random.normal(0, 1, 10)
在numpy数组上使用scipy.stats.percentileofscore:
from scipy import stats
np.vectorize(lambda x: stats.percentileofscore(arr, x))(arr)
在numpy数组或列表上使用scipy.stats.rankdata:
from scipy import stats
stats.rankdata(arr, "average") / len(arr)
使用 pandas.DataFrame.rank 在 Pandas DataFrame 上:
import numpy as np
df = pd.DataFrame(arr)
df.rank(pct=True)
这是一个简单的代码,用于计算列表中每个元素的百分位排名。我将给定元素的百分位定义为列表中小于或等于给定元素的元素百分比。
    import numpy as np
    x = [2,3,2,110,200,55,-1,0,6,45]
    ptile = [ (len(list(np.where(np.array(x)<=i)[0]))/len(x))*100  for i in x]
    print (ptile)

    O/P
    [40.0, 50.0, 40.0, 90.0, 100.0, 80.0, 10.0, 20.0, 60.0, 70.0]
对于给定的数组,你可以通过嵌套 argsort 高效地获得该数组中每个值的百分位。
my_array = np.random.randn(1000)
my_percentiles = (np.argsort(np.argsort(my_array))+1)/my_array.size
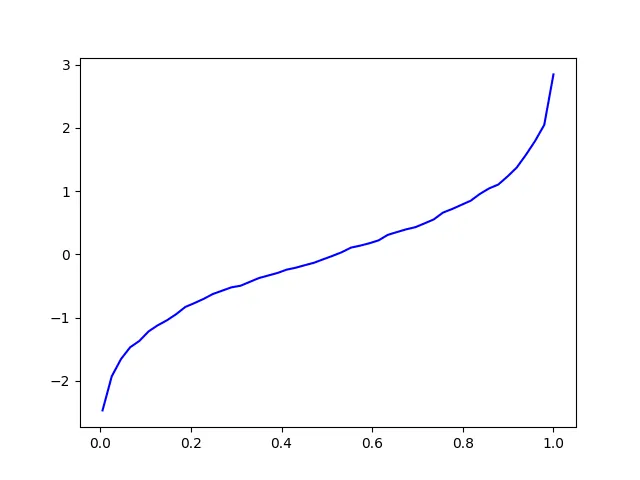
这里有一种替代方法。我认为你在询问如何估计概率积分变换。这段代码生成了一个相当精细的估计,即inverted_edf。
它通过在不同值的SAMPLE中计算线性插值来进行处理。然后它计算样本经验df,最后是inverted_edf。
我应该提到,即使样本大小为1,000,尾部的百分位数也会受到相当大的统计变异性的影响,尽管0.5的情况会较少。
import statsmodels.distributions.empirical_distribution as edf
from scipy.interpolate import interp1d
import numpy as np
import matplotlib.pyplot as plt

SAMPLE = np.random.normal(0, 1, 1000)
sample_edf = edf.ECDF(SAMPLE)

slope_changes = sorted(set(SAMPLE))

sample_edf_values_at_slope_changes = [ sample_edf(item) for item in slope_changes]
inverted_edf = interp1d(sample_edf_values_at_slope_changes, slope_changes)

x = np.linspace(0.005, 1)
y = inverted_edf(x)
#~ plt.plot(x, y, 'ro', x, y, 'b-')
plt.plot(x, y, 'b-')
plt.show()

p = 0.5
print ('%s percentile:' % (100*p), inverted_edf(p))
50.0 percentile: -0.05917394517540461
50.0 percentile: -0.0034011090849578695
percentiles = [percentileofscore(arr_sorted, i) for i in arr]来计算百分位数,无需使用pandas。 - ru111