WebKit/Safari支持类似于Firebug的控制台对象(console object)。但具体支持什么?Firebug有一个控制台文档,但我在哪里可以找到Safari/WebKit的控制台文档?
7个回答
66
原先支持的方法包括:
console.log()console.error()console.warn()console.info()
WebKit 的更新版本也添加了以下方法,使得 WebKit 控制台 API 几乎与 Firebug 的控制台 API 相同:
console.count()console.debug()console.profileEnd()console.trace()console.dir()console.dirxml()console.assert()console.time()console.profile()console.timeEnd()console.group()console.groupEnd()
(基于 WebKit 夜间构建版本 WebKit-SVN-r37126 的新信息,在撰写本文时这些方法在 Safari 中不可用)
- georgebrock
4
有没有办法将控制台日志重定向到文件? - Ashish
@Ashish:由JavaScript生成的日志?我不这么认为...大家怎么看?那会很有趣。 - Janusz Lenar
@Ashish 不是本地支持的(可能被利用 - 填满硬盘空间?),但你可以始终在服务器上写入套接字(使用Socket.io或类似工具)。默认情况下关闭,并使用查询字符串参数启用。这样,您的应用程序的生产版本不会默认执行此操作。您需要监视应用程序的多个实例(在不同的客户端)记录到同一台服务器,最好将其设置为127.0.0.1以进行本地开发测试?只是一个想法... - Ali
答案在下面,但是我在这里添加一下,以免大家错过。苹果公司的完整文档位于https://developer.apple.com/library/ios/documentation/AppleApplications/Conceptual/Safari_Developer_Guide/Console/Console.html。 - David W. Keith
13
我知道这是一个旧的、已经回答过的问题,但你也可以打开控制台并输入console.__proto__,然后你会获得一个可展开的列表,列出了它所支持的所有内容。
- Kerrick
3
尝试一下这个:
console.dir(console)
- George Mauer
0
控制台对象显然具有内置的“API”,以“私有属性”的形式出现,您可以通过在Webkit JavaScript控制台中执行此操作来揭示它
> for(o in console) console.dir(o)
    _commandLineAPI
    log
    warn
    …
_commandLineAPI:
> console.dir(_commandLineAPI)
  CommandLineAPI
    $0: "—"
    $1: "—"
    $2: "—"
    $3: "—"
    $4: "—"
    $$: bound: function () {
    $x: bound: function (xpath, context) {
    clear: bound: function () {
    copy: bound: function (object) {
    dir: bound: function () {
    dirxml: bound: function () {
    inspect: bound: function (object) {
    keys: bound: function (object) {
    monitorEvents: bound: function (object, types) {
    profile: bound: function () {
    profileEnd: bound: function () {
    unmonitorEvents: bound: function (object, types) {
    values: bound: function (object) {
    __proto__: CommandLineAPI
- arri
0
目前 Safari 控制台 URL 无法使用。
Here's copy(press "Run code snippet"):
<article id="contents" tabindex="0" role="main" class="isShowingTOC">
<a id="top" name="top"></a>
<a id="INDEX" href="/web/20170322101551/https://developer.apple.com/library/content/documentation/AppleApplications/Conceptual/Safari_Developer_Guide/index.html" style="display:none;" onclick="s_objectID="http://web.archive.org/web/20170322101551/https://developer.apple.com/library/content/documentati_9";return this.s_oc?this.s_oc(e):true"></a>
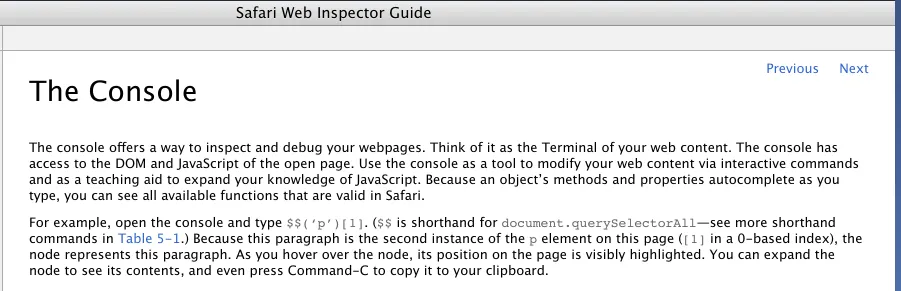
<a name="//apple_ref/doc/uid/TP40007874-CH6-SW1" title="The Console"></a><h1 id="pageTitle">The Console</h1><p>The console offers a way to inspect and debug your webpages. Think of it as the Terminal of your web content. The console has access to the DOM and JavaScript of the open page. Use the console as a tool to modify your web content via interactive commands and as a teaching aid to expand your knowledge of JavaScript. Because an object’s methods and properties autocomplete as you type, you can see all available functions that are valid in Safari.</p><p>For example, open the console and type <code>$$(‘p’)[1]</code>. (<code>$$</code> is shorthand for <code>document.querySelectorAll</code>—see more shorthand commands in <span class="content_text"><a href="#//apple_ref/doc/uid/TP40007874-CH6-SW7" data-renderer-version="1" onclick="s_objectID="http://web.archive.org/web/20170322101551/https://developer.apple.com/library/content/documentati_10";return this.s_oc?this.s_oc(e):true">Table 5-1</a></span>.) Because this paragraph is the second instance of the <code>p</code> element on this page (<code>[1]</code> in a 0-based index), the node represents this paragraph. As you hover over the node, its position on the page is visibly highlighted. You can expand the node to see its contents, and even press Command-C to copy it to your clipboard.</p><section><a name="//apple_ref/doc/uid/TP40007874-CH6-SW5" title="Command-Line API"></a><h2 class="jump">Command-Line API</h2><p>You can inspect HTML nodes and JavaScript objects in more detail by using the console commands listed in <span class="content_text">Table 5-1</span>. Type the command-line APIs interactively within the console.</p><p>If your scripts share the same function name as a Command-Line API function, the function in your scripts takes precedence.</p><a name="//apple_ref/doc/uid/TP40007874-CH6-SW7" title="Table 5-1Commands available in the Web Inspector console"></a><div class="tableholder"><table class="graybox" border="0" cellspacing="0" cellpadding="5"><caption class="tablecaption"><strong class="caption_number">Table 5-1</strong> Commands available in the Web Inspector console</caption><tbody><tr><th scope="col" class="TableHeading_TableRow_TableCell"><p>Command</p></th><th scope="col" class="TableHeading_TableRow_TableCell"><p>Description</p></th></tr><tr><td scope="row"><p><code>$(</code><em>selector</em><code>)</code></p></td><td><p>Shorthand for <code>document.querySelector</code>.</p></td></tr><tr><td scope="row"><p><code>$$(</code><em>selector</em><code>)</code></p></td><td><p>Shorthand for <code>document.querySelectorAll</code>.</p></td></tr><tr><td scope="row"><p><code>$x(</code><em>xpath</em><code>)</code></p></td><td><p>Returns an array of elements that match the given <span class="content_text"><a href="http://web.archive.org/web/20170322101551/http://www.w3.org/TR/xpath/" class="urlLink" rel="external" onclick="s_objectID="http://web.archive.org/web/20170322101551/http://www.w3.org/TR/xpath/_1";return this.s_oc?this.s_oc(e):true">XPath</a></span> expression.</p></td></tr><tr><td scope="row"><p><code>$0</code></p></td><td><p>Represents the currently selected node in the content browser.</p></td></tr><tr><td scope="row"><p><code>$</code><em>1..4</em></p></td><td><p>Represents the last, second to last, third to last, and fourth to last selected node in the content browser, respectively. </p></td></tr><tr><td scope="row"><p><code>$_</code></p></td><td><p>Returns the value of the last evaluated expression.</p></td></tr><tr><td scope="row"><p><code>dir(</code><em>object</em><code>)</code></p></td><td><p>Prints all the properties of the object.</p></td></tr><tr><td scope="row"><p><code>dirxml(</code><em>object</em><code>)</code></p></td><td><p>Prints all the properties of the object. If the object is a node, prints the node and all child nodes.</p></td></tr><tr><td scope="row"><p><code>keys(</code><em>object</em><code>)</code></p></td><td><p>Prints an array of the names of the object’s own properties.</p></td></tr><tr><td scope="row"><p><code>values(</code><em>object</em><code>)</code></p></td><td><p>Prints an array of the values of the object’s own properties.</p></td></tr><tr><td scope="row"><p><code>profile(</code><em>[title]</em><code>)</code></p></td><td><p>Starts the JavaScript profiler. The optional argument <code>title</code> contains the string to be printed in the header of the profile report. See <span class="content_text"><a href="/web/20170322101551/https://developer.apple.com/library/content/documentation/AppleApplications/Conceptual/Safari_Developer_Guide/Instruments/Instruments.html#//apple_ref/doc/uid/TP40007874-CH4-SW7" data-renderer-version="1" onclick="s_objectID="http://web.archive.org/web/20170322101551/https://developer.apple.com/library/content/documentati_11";return this.s_oc?this.s_oc(e):true">JavaScript and Events Recording</a></span>.</p></td></tr><tr><td scope="row"><p><code>profileEnd()</code></p></td><td><p>Stops the JavaScript profiler and prints its report. See <span class="content_text"><a href="/web/20170322101551/https://developer.apple.com/library/content/documentation/AppleApplications/Conceptual/Safari_Developer_Guide/Instruments/Instruments.html#//apple_ref/doc/uid/TP40007874-CH4-SW7" data-renderer-version="1" onclick="s_objectID="http://web.archive.org/web/20170322101551/https://developer.apple.com/library/content/documentati_12";return this.s_oc?this.s_oc(e):true">JavaScript and Events Recording</a></span>.</p></td></tr><tr><td scope="row"><p><code>getEventListeners(</code><em>object</em><code>)</code></p></td><td><p>Prints an object containing the object’s attached event listeners.</p></td></tr><tr><td scope="row"><p><code>monitorEvents(</code><em>object[, types]</em><code>)</code></p></td><td><p>Starts logging all events dispatched to the given object. The optional argument <code>types</code> defines specific events or event types to log, such as “click”.</p></td></tr><tr><td scope="row"><p><code>unmonitorEvents(</code><em>object[, types]</em><code>)</code></p></td><td><p>Stops logging for all events dispatched to the given object. The optional argument <code>types</code> defines specific events or event types to stop logging, such as “click”.</p></td></tr><tr><td scope="row"><p><code>inspect(</code><em>object</em><code>)</code></p></td><td><p>Inspects the given object; this is the same as clicking the Inspect button.</p></td></tr><tr><td scope="row"><p><code>copy(</code><em>object</em><code>)</code></p></td><td><p>Copies the given object to the clipboard.</p></td></tr><tr><td scope="row"><p><code>clear()</code></p></td><td><p>Clears the console.</p></td></tr></tbody></table></div><p>The functions listed in <span class="content_text">Table 5-1</span> are regular JavaScript functions that are part of the Web Inspector environment. That means you can use them as you would any JavaScript function. For example, you can assign a chain of Console API commands to a variable to create a useful shorthand. <span class="content_text">Listing 5-1</span> shows how you can quickly see all event types attached to the selected node.</p><a name="//apple_ref/doc/uid/TP40007874-CH6-SW6" title="Listing 5-1Find the events attached to this element"></a><p class="codesample clear"><strong class="caption_number">Listing 5-1</strong> Find the events attached to this element</p><div class="codesample clear"><table><tbody><tr><td scope="row"><pre>var evs = function () {<span></span></pre></td></tr><tr><td scope="row"><pre> return keys(getEventListeners($0));<span></span></pre></td></tr><tr><td scope="row"><pre>};<span></span></pre></td></tr></tbody></table></div><p>After defining this function, inspect the magnifying glass in the top-right corner of this webpage, and type <code>evs()</code> in the console. An array containing the string “click” is returned, because there is a click event listener attached to that element.</p><p>Of course, these functions shouldn’t be included in your website’s JavaScript files because they are not available in the browser environment. Only use these functions in the Web Inspector console. Console functions you can include in your scripts are described in <span class="content_text"><a href="#//apple_ref/doc/uid/TP40007874-CH6-SW3" data-renderer-version="1" onclick="s_objectID="http://web.archive.org/web/20170322101551/https://developer.apple.com/library/content/documentati_13";return this.s_oc?this.s_oc(e):true">Console API</a></span>.</p></section><section><a name="//apple_ref/doc/uid/TP40007874-CH6-SW3" title="Console API"></a><h2 class="jump">Console API</h2><p>You can output messages to the console, add markers to the timeline, and control the debugger directly from your scripts by using the commands listed in <span class="content_text">Table 5-2</span>.</p><div class="importantbox clear"><aside><a name="//apple_ref/doc/uid/TP40007874-CH6-DontLinkElementID_5" title="Important"></a><p><strong>Important:</strong> These functions exist to aid development and should not be included in any of your production JavaScript.</p><p></p></aside></div><a name="//apple_ref/doc/uid/TP40007874-CH6-SW8" title="Table 5-2JavaScript functions available in the Console API"></a><div class="tableholder"><table class="graybox" border="0" cellspacing="0" cellpadding="5"><caption class="tablecaption"><strong class="caption_number">Table 5-2</strong> JavaScript functions available in the Console API</caption><tbody><tr><th scope="col" class="TableHeading_TableRow_TableCell"><p>Function</p></th><th scope="col" class="TableHeading_TableRow_TableCell"><p>Description</p></th></tr><tr><td scope="row"><p><code>console.assert(expression, object)</code></p></td><td><p>Asserts whether the given expression is true. If the assertion fails, prints the error and increments the number of errors in the activity viewer. If the assertion succeeds, prints nothing.</p></td></tr><tr><td scope="row"><p><code>console.clear()</code></p></td><td><p>Clears the console.</p></td></tr><tr><td scope="row"><p><code>console.count([title])</code></p></td><td><p>Prints the number of times this line has been called.</p></td></tr><tr><td scope="row"><p><code>console.debug(object)</code></p></td><td><p>Alias of <code>console.log()</code>.</p></td></tr><tr><td scope="row"><p><code>console.dir(object)</code></p></td><td><p>Prints the properties and values of the object.</p></td></tr><tr><td scope="row"><p><code>console.dirxml(node)</code></p></td><td><p>Prints the DOM tree of an HTML or XML node.</p></td></tr><tr><td scope="row"><p><code>console.error(object)</code></p></td><td><p>Prints a message to the console with the error icon. Increments the number of errors shown in the activity viewer.</p></td></tr><tr><td scope="row"><p><code>console.group([title])</code></p></td><td><p>Prints subsequent logs under a disclosure of the given title.</p></td></tr><tr><td scope="row"><p><code>console.groupEnd()</code></p></td><td><p>Ends the previously declared console grouping.</p></td></tr><tr><td scope="row"><p><code>console.info(object)</code></p></td><td><p>Alias of <code>console.log()</code>.</p></td></tr><tr><td scope="row"><p><code>console.log(object)</code></p></td><td><p>Prints the object to the console with the log icon. Increments the number of logs shown in the activity viewer.</p></td></tr><tr><td scope="row"><p><code>console.markTimeline(</code><em>label</em><code>)</code></p></td><td><p>Marks the Timeline with a green vertical dashed line that indicates when this line of code was called. See <span class="content_text"><a href="/web/20170322101551/https://developer.apple.com/library/content/documentation/AppleApplications/Conceptual/Safari_Developer_Guide/Instruments/Instruments.html#//apple_ref/doc/uid/TP40007874-CH4-SW2" data-renderer-version="1" onclick="s_objectID="http://web.archive.org/web/20170322101551/https://developer.apple.com/library/content/documentati_14";return this.s_oc?this.s_oc(e):true">Recording Timelines</a></span>.</p></td></tr><tr><td scope="row"><p><code>console.profile(</code><em>[title]</em><code>)</code></p></td><td><p>Starts the JavaScript profiler. The optional argument <code>title</code> contains the string to be printed in the header of the profile report. See <span class="content_text"><a href="/web/20170322101551/https://developer.apple.com/library/content/documentation/AppleApplications/Conceptual/Safari_Developer_Guide/Instruments/Instruments.html#//apple_ref/doc/uid/TP40007874-CH4-SW7" data-renderer-version="1" onclick="s_objectID="http://web.archive.org/web/20170322101551/https://developer.apple.com/library/content/documentati_15";return this.s_oc?this.s_oc(e):true">JavaScript and Events Recording</a></span>.</p></td></tr><tr><td scope="row"><p><code>console.profileEnd(</code><em>[title]</em><code>)</code></p></td><td><p>Stops the JavaScript profiler and prints its report. See <span class="content_text"><a href="/web/20170322101551/https://developer.apple.com/library/content/documentation/AppleApplications/Conceptual/Safari_Developer_Guide/Instruments/Instruments.html#//apple_ref/doc/uid/TP40007874-CH4-SW7" data-renderer-version="1" onclick="s_objectID="http://web.archive.org/web/20170322101551/https://developer.apple.com/library/content/documentati_16";return this.s_oc?this.s_oc(e):true">JavaScript and Events Recording</a></span>.</p></td></tr><tr><td scope="row"><p><code>console.time(</code><em>name</em><code>)</code></p></td><td><p>Starts a timer associated with the given name. Useful for timing the duration of segments of code.</p></td></tr><tr><td scope="row"><p><code>console.timeEnd(</code><em>name</em><code>)</code></p></td><td><p>Stops the timer associated with the given name and prints the elapsed time to the console.</p></td></tr><tr><td scope="row"><p><code>console.trace()</code></p></td><td><p>Prints a stack trace at the moment the function is called. See <span class="content_text"><a href="/web/20170322101551/https://developer.apple.com/library/content/documentation/AppleApplications/Conceptual/Safari_Developer_Guide/Debugger/Debugger.html#//apple_ref/doc/uid/TP40007874-CH5-SW6" data-renderer-version="1" onclick="s_objectID="http://web.archive.org/web/20170322101551/https://developer.apple.com/library/content/documentati_17";return this.s_oc?this.s_oc(e):true">Figure 4-2</a></span>.</p></td></tr><tr><td scope="row"><p><code>console.warn(</code><em>object</em><code>)</code></p></td><td><p>Prints a message to the console with the warning icon. Increments the number of warnings shown in the activity viewer.</p></td></tr><tr><td scope="row"><p><code>debugger</code></p></td><td><p>Stops JavaScript execution at the current line. This is the equivalent of setting a breakpoint programmatically. See <span class="content_text"><a href="/web/20170322101551/https://developer.apple.com/library/content/documentation/AppleApplications/Conceptual/Safari_Developer_Guide/Debugger/Debugger.html#//apple_ref/doc/uid/TP40007874-CH5-SW2" data-renderer-version="1" onclick="s_objectID="http://web.archive.org/web/20170322101551/https://developer.apple.com/library/content/documentati_18";return this.s_oc?this.s_oc(e):true">Breakpoints</a></span>.</p></td></tr></tbody></table></div></section>
<div class="copyright"><br><hr><div align="center"><p class="content_text" lang="en" dir="ltr"> Updated: 2016-09-13</p></div></div>
<div id="pediaWindow">
<div id="pediaHeader"></div>
<div id="pediaBody"></div>
</div>
</article>- Laimonas
网页内容由stack overflow 提供, 点击上面的可以查看英文原文,
原文链接
原文链接