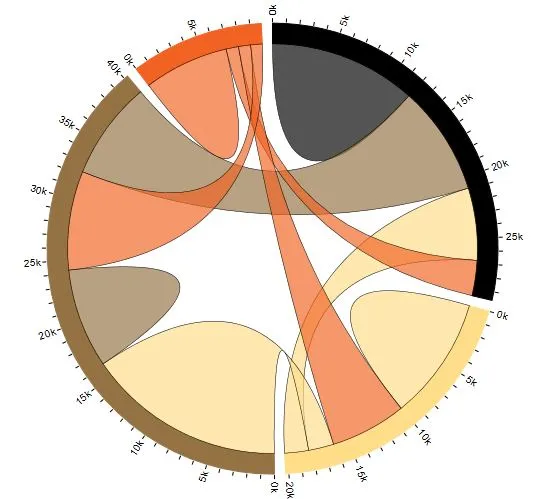
我是一名新手程序员,所以这对大多数人来说可能很容易。我需要哪些代码行来为这个弦图添加标签和/或悬停文本?
http://mbostock.github.com/d3/ex/chord.html
编辑:
我仍然无法弄清如何在我的代码中实现它。有人能填写我的示例代码并解释一下发生了什么吗?
    <!DOCTYPE html>
<html>
  <head>
    <meta http-equiv="Content-type" content="text/html; charset=utf-8">
    <title>Selecties EK 2010</title>
    <script type="text/javascript" src="d3.v2.js"></script>
    <link type="text/css" rel="stylesheet" href="ek2010.css"/>
  </head>
  <body>
    <div id="chart"></div>
    <script type="text/javascript" src="ek2010.js"></script>
  </body>
</html>
并且
// From http://mkweb.bcgsc.ca/circos/guide/tables/
var chord = d3.layout.chord()
    .padding(.05)
    .sortSubgroups(d3.descending)
    .matrix([
      [0, 0, 7, 5],
      [0, 0, 8, 3],
      [7, 8, 0, 0],
      [5, 3, 0, 0]
    ]);

var width = 1000,
    height = 1000,
    innerRadius = Math.min(width, height) * .3,
    outerRadius = innerRadius * 1.1;

var fill = d3.scale.ordinal()
    .domain(d3.range(4))
    .range(["#000000", "#FFDD89", "#957244", "#F26223"]);

var svg = d3.select("#chart")
  .append("svg")
    .attr("width", width)
    .attr("height", height)
  .append("g")
    .attr("transform", "translate(" + width / 2 + "," + height / 2 + ")");

svg.append("g")
  .selectAll("path")
    .data(chord.groups)
  .enter().append("path")
    .style("fill", function(d) { return fill(d.index); })
    .style("stroke", function(d) { return fill(d.index); })
    .attr("d", d3.svg.arc().innerRadius(innerRadius).outerRadius(outerRadius))
    .on("mouseover", fade(.1))
    .on("mouseout", fade(1));

var ticks = svg.append("g")
  .selectAll("g")
    .data(chord.groups)
  .enter().append("g")
  .selectAll("g")
    .data(groupTicks)
  .enter().append("g")
    .attr("transform", function(d) {
      return "rotate(" + (d.angle * 180 / Math.PI - 90) + ")"
          + "translate(" + outerRadius + ",0)";
    });

ticks.append("line")
    .attr("x1", 1)
    .attr("y1", 0)
    .attr("x2", 5)
    .attr("y2", 0)
    .style("stroke", "#000");

ticks.append("text")
    .attr("x", 8)
    .attr("dy", ".35em")
    .attr("text-anchor", function(d) {
      return d.angle > Math.PI ? "end" : null;
    })
    .attr("transform", function(d) {
      return d.angle > Math.PI ? "rotate(180)translate(-16)" : null;
    })
    .text(function(d) { return d.label; });

svg.append("g")
    .attr("class", "chord")
  .selectAll("path")
    .data(chord.chords)
  .enter().append("path")
    .style("fill", function(d) { return fill(d.target.index); })
    .attr("d", d3.svg.chord().radius(innerRadius))
    .style("opacity", 1);

/** Returns an array of tick angles and labels, given a group. */
function groupTicks(d) {
  var k = (d.endAngle - d.startAngle) / d.value;
  return d3.range(0, d.value, 1).map(function(v, i) {
    return {
      angle: v * k + d.startAngle,
      label: i % 5 ? null : v / 1 + " internat."
    };
  });
}

/** Returns an event handler for fading a given chord group. */
function fade(opacity) {
  return function(g, i) {
    svg.selectAll("g.chord path")
        .filter(function(d) {
          return d.source.index != i && d.target.index != i;
        })
      .transition()
        .style("opacity", opacity);
  };
}