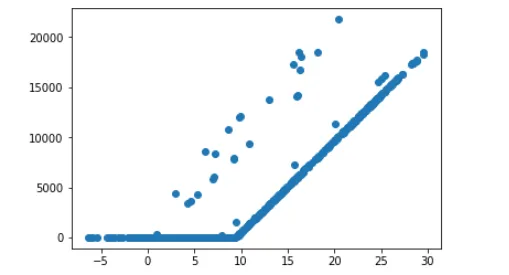
我目前正在使用TensorFlow和SkLearn尝试创建一个模型,基于摄氏度下的室外温度来预测某个产品X的销售额。 我将温度数据集设置为x变量,并将销售额设置为y变量。如下图所示,温度和销售额之间存在某种相关性:
这导致预测线的拟合程度相当差:
我会得到输出。
首先,我尝试进行线性回归以查看它的拟合效果。以下是该代码:
from sklearn.linear_model import LinearRegression

model = LinearRegression()
model.fit(x_train, y_train) #fit tries to fit the x variable and y variable.

#Let's try to plot it out.
y_pred = model.predict(x_train)

plt.scatter(x_train,y_train)
plt.plot(x_train,y_pred,'r')
plt.legend(['Predicted Line', 'Observed data'])
plt.show()
这导致预测线的拟合程度相当差:
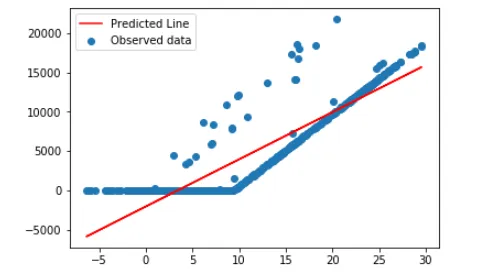
model.predict(15)
我会得到输出。
array([6949.05567873])
这正是我想要的,我只是希望这行更加适合,因此我尝试使用sklearn进行多项式回归,具体如下:
from sklearn.preprocessing import PolynomialFeatures
poly = PolynomialFeatures(degree=8, include_bias=False) #the bias is avoiding the need to intercept
x_new = poly.fit_transform(x_train)
new_model = LinearRegression()
new_model.fit(x_new,y_train)

#plotting
y_prediction = new_model.predict(x_new) #this actually predicts x...?
plt.scatter(x_train,y_train)
plt.plot(x_new[:,0], y_prediction, 'r')
plt.legend(['Predicted line', 'Observed data'])
plt.show()
现在这条线看起来更适合了: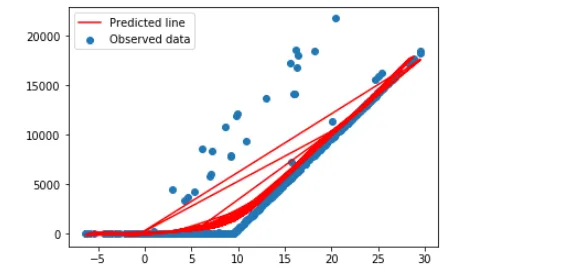
我的问题不是我不能使用 new_model.predict(x),因为它会导致"ValueError: shapes (1,1) and (8,) not aligned: 1 (dim 1) != 8 (dim 0)"。我知道这是因为我正在使用一个8次多项式,但有没有办法让我基于一个温度预测y轴,使用多项式回归模型?
new_model.predict([x for _ in range(8)])吗? - Sheldorenew_model.predict([[30 for x_train in range(8)]]),我确实会得到一个输出,但输出为 **array([2862.55322278])**。根据模型,我期望的输出超过15k,你有什么想法,为什么我会得到这样一个低的数字? - Thomas