这些解决方案仅在某种程度上有效,问题在于像素大小会随纬度变化。因此,如果您需要通用解决方案(且无法与mapbox交流),我使用了opencv在“测试图像”上找到最大和最小的纬度和经度点,然后从最大缩放级别(有时为22或直接跳过到20)到最小缩放级别0计算y轴上的像素长度和x轴上的像素长度。
这是使用粉色和橙色标出的最大和最小纬度和经度点生成的示例“测试图像”:
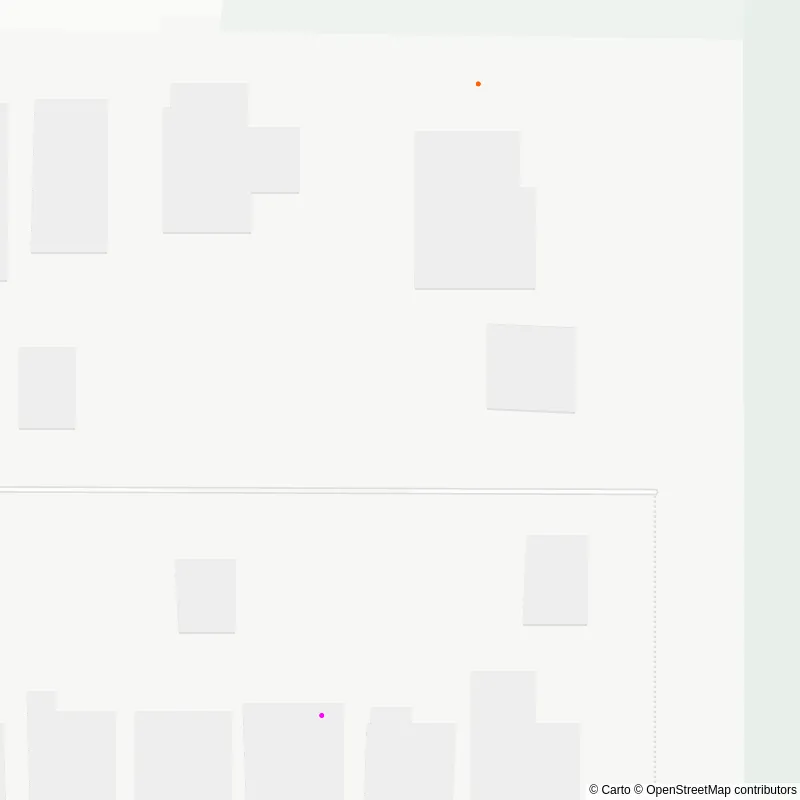
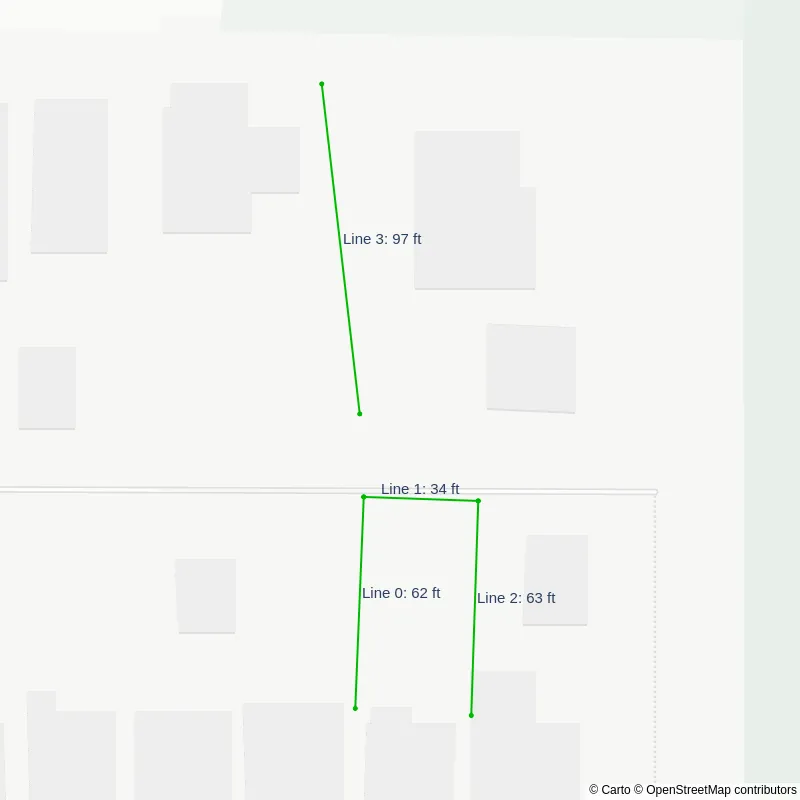
这是一个带注释地图的图像:
def get_marker_location(self, color_min, color_max, hsv):
mask = cv2.inRange(hsv, color_min, color_max)
if cv2.countNonZero(mask) == 0:
return False, None, None
cnts, hierarchies = cv2.findContours(mask, cv2.RETR_EXTERNAL, cv2.CHAIN_APPROX_SIMPLE)
for i in cnts:
M = cv2.moments(i)
if M['m00'] != 0:
cX = int(M["m10"] / M["m00"])
cY = int(M["m01"] / M["m00"])
return True, cX, cY
def get_zoom(self, lons, lats, height, width):
fig = go.Figure()
maxlon, minlon = np.amax(lons), np.amin(lons)
maxlat, minlat = np.amax(lats), np.amin(lats)
center = {
'lon': round((maxlon + minlon) / 2, 6),
'lat': round((maxlat + minlat) / 2, 6)
}
pink_min = (147,219,208)
pink_max = (153,255,255)
fig.add_trace(go.Scattermapbox(lon=[minlon], lat=[minlat],
mode='markers',
marker=dict(color='#FF00FF')))
orange_min = np.array([10,230,236])
orange_max = np.array([12,255,255])
fig.add_trace(go.Scattermapbox(lon=[maxlon], lat=[maxlat],
mode='markers',
marker=dict(color='#FF6000')))
start_zoom = 20
extra_zoom_threshold = 0.01524
max_min_dist = gpd.geodesic(gp.Point(minlat, minlon),gp.Point(maxlat, maxlon)).km
print(f'max_min_dist: {max_min_dist}')
print(f'extra_zoom_threshold: {extra_zoom_threshold}')
if extra_zoom_threshold > max_min_dist:
start_zoom = 22
for i in range(start_zoom, -1, -1):
fig.update_layout(template='plotly_white',
showlegend=False, height=height, width=width,
margin={'l': 0,'r': 0,'b': 0,'t': 0,},
mapbox={'style':'carto-positron',
'zoom':i,
'center': {'lon': center['lon'], 'lat': center['lat']}})
fig.write_image("check_zoom.png")
img = cv2.imread('check_zoom.png')
hsv = cv2.cvtColor(img, cv2.COLOR_BGR2HSV)
pink_loc = dict()
orange_loc = dict()
pink_loc['in_image'], pink_loc['cX'], pink_loc['cY'] = self.get_marker_location(pink_min, pink_max, hsv)
orange_loc['in_image'], orange_loc['cX'], orange_loc['cY'] = self.get_marker_location(orange_min, orange_max, hsv)
if (pink_loc['in_image'] and orange_loc['in_image']) or i == 0:
pixel_len_lonx = gpd.geodesic(gp.Point(center['lat'], minlon),gp.Point(center['lat'], maxlon)).km / abs(orange_loc['cX'] - pink_loc['cX'])
pixel_len_laty = gpd.geodesic(gp.Point(minlat, center['lon']),gp.Point(maxlat, center['lon'])).km / abs(orange_loc['cY'] - pink_loc['cY'])
dy = (height/2)*pixel_len_laty
dx = (width/2)*pixel_len_lonx
max_lat = gpd.geodesic(kilometers=dy).destination(gp.Point(center['lat'], center['lon']), 0)[0]
min_lat = gpd.geodesic(kilometers=dy).destination(gp.Point(center['lat'], center['lon']), 180)[0]
max_lon = gpd.geodesic(kilometers=dx).destination(gp.Point(center['lat'], center['lon']), 90)[1]
min_lon = gpd.geodesic(kilometers=dx).destination(gp.Point(center['lat'], center['lon']), 270)[1]
return i, center, max_lat, min_lat, max_lon, min_lon
def get_mapbox_site_map(self):
fig = go.Figure()
height = 800
width = 800
annotation_counter = 0
if len(self.lines_df):
l_lat = np.concatenate(self.lines_df['lines'].apply(lambda g: [c[0] for c in g] + [None]).values)
l_lon = np.concatenate(self.lines_df['lines'].apply(lambda g: [c[1] for c in g] + [None]).values)
if len(self.gates_df):
g_lat = np.concatenate(self.gates_df['gates'].apply(lambda g: [c[0] for c in g] + [None]).values)
g_lon = np.concatenate(self.gates_df['gates'].apply(lambda g: [c[1] for c in g] + [None]).values)
if len(self.gates_df) and len(self.lines_df):
lg_lat = np.concatenate((l_lat, g_lat))
lg_lon = np.concatenate((l_lon, g_lon))
zoom, center, max_lat, min_lat, max_lon, min_lon = self.get_zoom(lg_lon[lg_lon != None], lg_lat[lg_lat != None], height, width)
elif len(self.lines_df):
zoom, center, max_lat, min_lat, max_lon, min_lon = self.get_zoom(l_lon[l_lon != None], l_lat[l_lat != None], height, width)
elif len(self.gates_df):
zoom, center, max_lat, min_lat, max_lon, min_lon = self.get_zoom(g_lon[g_lat != None], g_lat[g_lat != None], height, width)
for index in self.lines_df.index:
line = self.lines_df.at[index, 'lines']
pt1 = line[0]
pt2 = line[1]
x_annotation = min(pt1[1], pt2[1]) + (abs(pt2[1] - pt1[1]) / 2)
y_annotation = min(pt1[0], pt2[0]) + (abs(pt2[0] - pt1[0]) / 2)
x_annotation = (x_annotation - min_lon)/(max_lon - min_lon)
y_annotation = (y_annotation - min_lat)/(max_lat - min_lat)
if 2 * (abs(pt2[1] - pt1[1]) / 2) <= (abs(pt2[0] - pt1[0]) / 2):
xanchor = 'left'
else:
xanchor = 'center'
str_i = str(index).replace('Line ', 'L')
fig.add_annotation(x=x_annotation,
xanchor=xanchor,
y=y_annotation,
xref='paper',yref='paper',
yanchor='bottom',
text=f'<b>{str_i}: {str(self.lines_df.at[index, "distance"])}ft</b>',
font=dict(size=15, color="darkgreen"),
showarrow=False)
annotation_counter += 1
if len(self.lines_df):
fig.add_trace(go.Scattermapbox(lon=l_lon, lat=l_lat,
mode='markers+lines',
marker=dict(color='#00B900'),
line=dict(color='#00B900')))
annotation_counter = 0
for index in self.gates_df.index:
gate = self.gates_df.at[index, 'gates']
pt1 = gate[0]
pt2 = gate[1]
x_annotation = min(pt1[1], pt2[1]) + (abs(pt2[1] - pt1[1]) / 2)
y_annotation = min(pt1[0], pt2[0]) + (abs(pt2[0] - pt1[0]) / 2)
x_annotation = (x_annotation - min_lon)/(max_lon - min_lon)
y_annotation = (y_annotation - min_lat)/(max_lat - min_lat)
if 2 * (abs(pt2[1] - pt1[1]) / 2) <= (abs(pt2[0] - pt1[0]) / 2):
xanchor = 'left'
else:
xanchor = 'center'
str_i = str(index).replace('Gate ', 'G')
fig.add_annotation(x=x_annotation,
xanchor=xanchor,
y=y_annotation,
xref='paper',yref='paper',
yanchor='bottom',
text=f'<b>{str_i}: {str(self.gates_df.at[index, "distance"])}ft</b>',
font=dict(size=15, color="#361c00"),
showarrow=False)
annotation_counter += 1
if len(self.gates_df):
fig.add_trace(go.Scattermapbox(lon=g_lon, lat=g_lat,
mode='markers+lines',
marker=dict(color='#8B4513'),
line=dict(color='#8B4513')))
fig.update_yaxes(showticklabels=False)
fig.update_layout(template='plotly_white',
showlegend=False, height=height, width=width,
margin={'l': 0,'r': 0,'b': 0,'t': 0,},
mapbox={'style':'carto-positron',
'zoom':zoom,
'center': {'lon': center['lon'], 'lat': center['lat']}})
filtered_df? - Derek O