ggiraph绘图无法调整大小以适应页面。

5

这是我的代码:

library(shiny)
library(ggplot2)
library(ggiraph)

df <- data.frame(achseX = LETTERS[1:24], achseY = 1:24, facetX = as.factor(rep(1:4, each = 6)))

server <- function(input, output) {
  output$ggplot <- renderPlot({
    ggplot(data = df) + geom_bar_interactive(aes(tooltip = achseY, x = achseX, y = achseY), stat = "identity") +
      theme_minimal() + facet_grid(.~ facetX, scales = "free_x")
  })


  output$plot <- renderggiraph({
    gg <- ggplot(data = df) + geom_bar_interactive(aes(tooltip = achseY, x = achseX, y = achseY), stat = "identity") +
      theme_minimal() + facet_grid(.~ facetX, scales = "free_x")
    return(ggiraph(code = print(gg), selection_type = "multiple", zoom_max = 4,
                   hover_css = "fill:#FF3333;stroke:black;cursor:pointer;",
                   selected_css = "fill:#FF3333;stroke:black;"))
  })
}

ui <- fluidPage(
  "GGPLOT2:",
  plotOutput("ggplot"),
  "GGIRAPH:",
  ggiraphOutput("plot", width = "500px", height = "1000px")
)

shinyApp(ui = ui, server = server)

结果如下图所示: enter image description here 
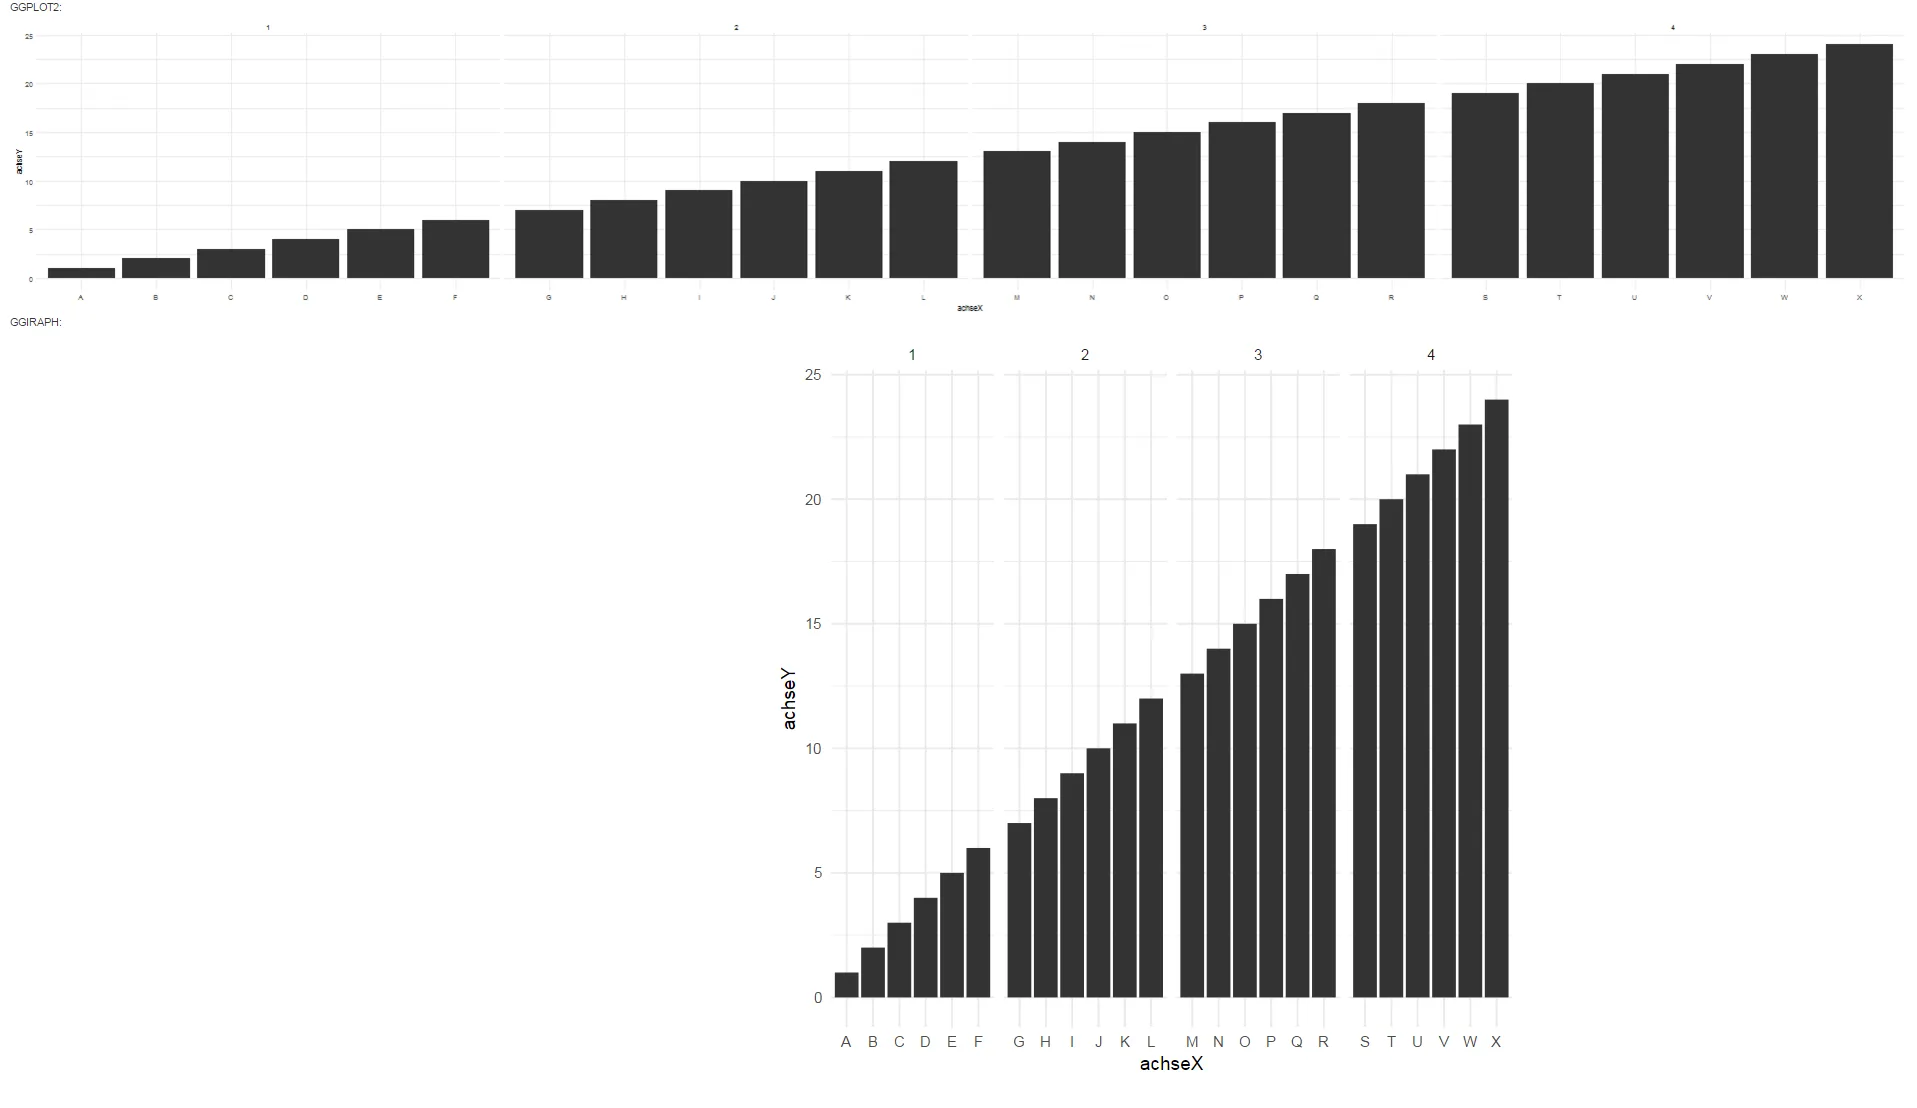
从代码中可以看出,第一个条形图是一个正常工作的ggplot。它可以响应网站并具有矩形格式。相反,ggiraph保持在正方形格式中,不适合页面。
引用块中问道:“我该如何让ggiraph看起来像ggplot呢?”
我尝试了几种宽度和高度参数的组合,包括width =“auto”height =“auto”。这使得ggiraph适合页面,但仍然是一个正方形格式。
2个回答

6
您可以在一些JS代码中使UI响应。类似于这个答案 (链接)
不同之处在于ggiraph函数需要以英寸为单位输入,因此我们需要将像素转换为英寸。公式为:inches = pixels/dpi。因此,在UI中的JS代码传递窗口高度和dpi屏幕宽度,从而可以计算出长度(以英寸为单位),然后将其传递给ggiraph函数,从而使图表对UI响应。
我已经修改了您的示例来实现这一点。希望能有所帮助!
 library(shiny)
 library(ggplot2)
 library(ggiraph)

 df <- data.frame(achseX = LETTERS[1:24], achseY = 1:24, facetX = as.factor(rep(1:4, each = 6)))

 server <- function(input, output, session) {
   output$ggplot <- renderPlot({
     ggplot(data = df) + geom_bar_interactive(aes(tooltip = achseY, x = achseX, y = achseY), stat = "identity") +
       theme_minimal() + facet_grid(.~ facetX, scales = "free_x")
   })


   output$plot <- renderggiraph({
     gg <- ggplot(data = df) + geom_bar_interactive(aes(tooltip = achseY, x = achseX, y = achseY), stat = "identity") +
       theme_minimal() + facet_grid(.~ facetX, scales = "free_x")
     return(ggiraph(code = print(gg), selection_type = "multiple", zoom_max = 4,
                    hover_css = "fill:#FF3333;stroke:black;cursor:pointer;",
                    selected_css = "fill:#FF3333;stroke:black;", 
                    width_svg = (0.8*input$pltChange$width/input$pltChange$dpi),
                    height_svg = (0.5*input$pltChange$height/input$pltChange$dpi)
                    ))
   })
 }

 ui <- fluidPage(

   tags$body(tags$div(id="ppitest", style="width:1in;visible:hidden;padding:0px")),

   tags$script('$(document).on("shiny:connected", function(e) {
                                    var w = window.innerWidth;
                                    var h = window.innerHeight;
                                    var d =  document.getElementById("ppitest").offsetWidth;
                                    var obj = {width: w, height: h, dpi: d};
                                    Shiny.onInputChange("pltChange", obj);
                                });
                                $(window).resize(function(e) {
                                    var w = $(this).width();
                                    var h = $(this).height();
                                    var d =  document.getElementById("ppitest").offsetWidth;
                                    var obj = {width: w, height: h, dpi: d};
                                    Shiny.onInputChange("pltChange", obj);
                                });
                            '),


   "GGPLOT2:",
   plotOutput("ggplot"),
   "GGIRAPH:",
   ggiraphOutput("plot")
 )

 shinyApp(ui = ui, server = server) 

几年过去了,这个答案仍然非常有用,谢谢@SBista。 - Matt Cowgill
如果您能标记出您添加的代码,以便一目了然,那将更加有帮助。 - Markus Bauer

4

网页内容由stack overflow 提供, 点击上面的
可以查看英文原文,
原文链接