我想在由 xtable 输出的表格下添加注释。我发现最好的选择是使用“caption”选项:xtable(tablename,caption =“这是标题”)。但是这会自动加入“Table 1”,因此输出结果如下:
Table 1:这是标题。
有没有办法抑制这种情况或者以某种更简单的方式将注释作为表格的附加最后一行插入?
我想在由 xtable 输出的表格下添加注释。我发现最好的选择是使用“caption”选项:xtable(tablename,caption =“这是标题”)。但是这会自动加入“Table 1”,因此输出结果如下:
Table 1:这是标题。
有没有办法抑制这种情况或者以某种更简单的方式将注释作为表格的附加最后一行插入?
首先,一些模拟数据:
x <- sample(LETTERS, 5, replace = TRUE)
y <- sample(LETTERS, 5, replace = TRUE)
z <- table(x, y)
现在这里有一个有些笨拙的解决方案,使用 print.xtable 的 add.to.row 参数。
comment          <- list()
comment$pos      <- list()
comment$pos[[1]] <- c(nrow(z))
comment$command  <- c(paste("\\hline \n",  # we`ll replace all default hlines with this and the ones below
                            "your footnote, caption or whatever.  \n",
                            sep = ""))
print(xtable(z),
      add.to.row = comment,
      hline.after = c(-1, 0))  # indicates rows that will contain hlines (the last one was defined up there)
comment$pos[[1]] <- c(0) 替代 comment$pos[[1]] <- c(nrow(z)) 并相应地调整 hline.after。% latex table generated in R 2.14.1 by xtable 1.7-0 package
% Mon Feb 20 02:17:58 2012
\begin{table}[ht]
\begin{center}
\begin{tabular}{rrrrr}
\hline
& B & C & P & V \\
\hline
A & 0 & 0 & 0 & 1 \\
D & 1 & 0 & 0 & 0 \\
I & 0 & 0 & 0 & 1 \\
P & 0 & 0 & 1 & 0 \\
Z & 0 & 1 & 0 & 0 \\
\hline
your footnote, caption or whatever.
\end{tabular}
\end{center}
\end{table}
这基本上是重新利用这个答案,但这是使用xtable最编程化的方法来完成。它很难看,主要是因为我讨厌xtable的add.to.row参数的工作方式。
示例数据:
set.seed(230)
DF <- data.frame(a = rnorm(5), b = rnorm(5), c = rnorm(5))

#of course, we can pass this directly below; I'm just saving
#  horizontal space for this answer
comm <- paste0("\\hline \n \\multicolumn{4}{l}",
           "{\\scriptsize{Check out these random numbers!}} \n")

print.xtable(xtable(DF, caption = "Describe the table"),
             #adjusting hline.after so that our comment appears
             #  "outside" the table, as defined by its border
             hline.after=c(-1, 0),
             #**NOTE: the first argument to add.to.row must be
             #  a list -- don't ask me why since it strikes me as odd**
             add.to.row = list(pos = list(5),
                               command = comm))
% latex table generated in R 3.2.4 by xtable 1.8-2 package
% Mon May 23 18:25:14 2016
\begin{table}[ht]
\centering
\begin{tabular}{rrrr}
  \hline
 & a & b & c \\
  \hline
1 & -0.23 & 0.04 & 1.34 \\
  2 & 0.10 & 0.57 & -1.62 \\
  3 & 0.33 & -0.14 & 0.83 \\
  4 & 0.36 & -0.75 & 0.20 \\
  5 & 0.44 & 0.13 & -0.49 \\
   \hline
 \multicolumn{4}{l}{\scriptsize{Check out these random numbers!}}
\end{tabular}
\caption{Describe the table}
\end{table}
\documentclass{article},\begin{document}和\end{document}将其包装起来,那么.pdf文件的结果如下图所示: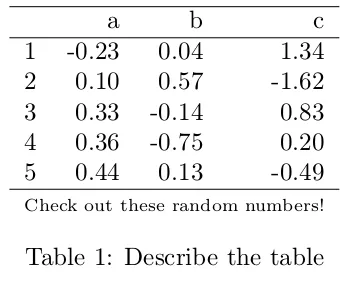 当然,还有更多的细节需要添加,以使其达到出版的要求,但这是关键,您应该已经明白了。
---
(other configs here, like title, author, etc.)

header-includes:
    - \usepackage{caption}
    - \captionsetup{labelformat=empty}
---
编辑:
在与xtable软件包维护者David(非常可靠)交谈后,他提供了下面的解决方案:
我认为可以使用xtableList来解决这个问题。创建一些数据并将数据框转换为xtableList。
set.seed(230)
DF <- data.frame(a = rnorm(5), b = rnorm(5), c = rnorm(5))
library(xtable)
dfList <- list(DF)
attr(dfList, "message") <- c("A caption", "Which can have multiple lines")
print(xtableList(dfList))
## % latex table generated in R 3.2.5 by xtable 1.8-3 package
## % Sat Jul 09 21:52:53 2016
## \begin{table}[ht]
## \centering
## \begin{tabular}{rrrr}
## \hline
## & a & b & c \\
## \hline
## 1 & -0.23 & 0.04 & 1.34 \\
## 2 & 0.10 & 0.57 & -1.62 \\
## 3 & 0.33 & -0.14 & 0.83 \\
## 4 & 0.36 & -0.75 & 0.20 \\
## 5 & 0.44 & 0.13 & -0.49 \\
## \hline
## \multicolumn{4}{l}{A caption}\\
##
## \multicolumn{4}{l}{Which can have multiple lines}\\
## \end{tabular}
## \end{table}
attr(dfList, "message") <- c("A caption", "Which can have", "multiple lines")