在xtable中是否可以创建latex多列?

39

我正在使用R Markdown和knitr中的xtable来生成.tex文件,然后通过\input{}调用它们。效果不错,但我还没有想出如何创建多列表格,就像这里显示的那样。有人知道该如何实现吗?

到目前为止,我正在使用:

tbl <- xtable(data, align="l r r r r r")
colnames(tbl) <- c("Variable", 
                  "Mean", "Std Dev", 
                  "Mean", "Std Dev", 
                  "Difference")
caption(tbl) <- c("Table Title")
print(tbl, 
    include.rownames=FALSE,
    caption.placement="top",
    booktabs=TRUE,
    type="latex", 
    file="output.tex")

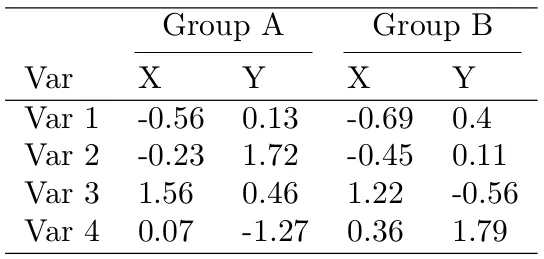
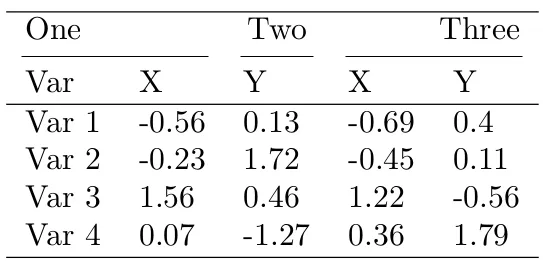
我希望在每个“Mean”和“Std Dev”(“Treatment”和“Control”)上有不同的分组标题。

或者,是否有更好的方法使用R Markdown/knitr自动生成表格?我不想手动编辑表格,因为报告需要自动生成。

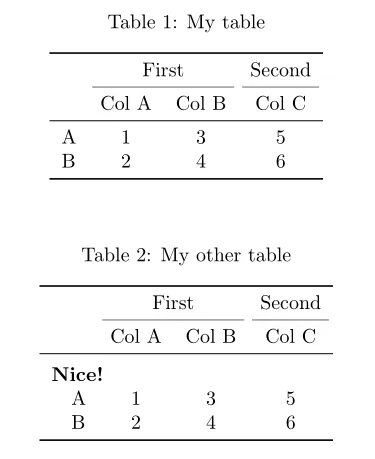
更新:@agstudy:我对LaTeX不熟悉,但我认为这就是我想要通过xtable(或类似xtable的东西)自动产生的输出:

\begin{tabular}{lrrrrr}
  \toprule
      & \multicolumn{2}{c}{Treatment} & \multicolumn{2}{c}{Control} & \\
  \cmidrule(lr){2-3} \cmidrule(lr){4-5}
  Variable & Mean & Std Dev & Mean & Std Dev & Difference \\ 
  \midrule
  var1 & 1 & 2 & 3 & 4 & 5 \\ 
  \bottomrule
\end{tabular}

更新2:@Jonathan:我读了几遍才明白你在建议什么。我采纳了你的建议,它起作用了。

现在在R markdown块中,我使用以下内容:

tbl <- xtable(data)
print(tbl,
    only.contents=TRUE,
    include.rownames=FALSE,
    type="latex",
    digits(tbl) <- c(0,1,1,1,1,1),
    file="output/tblout.tex")

然后在文本中,我使用:

\begin{tabular}{lddddd}
\toprule
    & \multicolumn{2}{c}{Treatment} & \multicolumn{2}{c}{Control} & \\
    \cmidrule(lr){2-3} \cmidrule(lr){4-5}
    Variable  &  \multicolumn{1}{r}{Mean}  &  \multicolumn{1}{r}{Std Dev}  &       \multicolumn{1}{r}{Mean}  &  \multicolumn{1}{r}{Std Dev}  &  \multicolumn{1}{r}{Difference}  \\
\midrule
\input{../output/tblout}
\bottomrule
\end{tabular}

我会看看是否有其他人对于本地的xtable(或其他包)有什么建议。否则,我将接受您的答案。谢谢!


请问您能否添加一份期望的 LaTeX 输出样例? - agstudy
请参考以下链接:https://stackoverflow.com/questions/44324042/r-xtable-with-multicolumns-and-booktabs - Frank
6个回答

35
我认为xtable中的add.to.row选项可以完美实现这一点。
以下是示例代码:
require(xtable)
age <- sample(c('30-50', '50-70', '70+'), 200, replace=T)
sex <- sample(c('Male', 'Female'), 200, replace=T)
val <- table(age, sex)
val <- rbind(val, formatC(prop.table(val)*100, format='f', digits=1))
val <- structure(val, dim=c(3, 4))
val <- rbind(c('n', '%'), val)
rownames(val) <- c('', sort(unique(age)))
val <- xtable(val)


addtorow <- list()
addtorow$pos <- list(0)
addtorow$command <- paste0(paste0('& \\multicolumn{2}{c}{', sort(unique(sex)), '}', collapse=''), '\\\\')

print(val, add.to.row=addtorow, include.colnames=F)

4
这对我非常有效,我只想添加两个提示:1. pos变量是一个列表中的列表,而不是标量或向量(我错过了这一点),2.pos变量可以设置为0(将添加的行放在标题下方)甚至是-1(将其放在标题上方,这正是我想要的)。 - slammaster
6
这应该是被接受的答案!这里 还有另一个使用add.to.row参数与\multirow一起使用的例子。 - ToJo
1
请参阅vignette中的“Use of add.to.row argument”部分:https://cran.r-project.org/web/packages/xtable/vignettes/xtableGallery.pdf - Frank

18

假设表格的格式在不同运行中都是相同的(即只有数字发生变化),我的建议是使用only.contents参数来调用print.xtable函数,并手动编写多列标题。据我所知,xtable本身不能实现多列单元格。


7

例如,如果您的数据是名为dat的数据框,其中包含三列:Group,一个具有“Control”和“Treatment”级别的因子;var,一个具有“var1”,“var2”(等等)级别的因子;以及value,它是数字,您可以执行以下操作:latex(tabular(var~Heading()*Group*((mean+sd)*Heading()*value), data=dat)来获取所需的表格类型。 ?tables::tabular中的示例有助于解释语法。 - Caroline Ring

5

这是一个与 kableExtra 相关的儿童游戏。

\documentclass{article}
\usepackage{booktabs}
\begin{document}

<<setup, include=FALSE>>=
library(knitr)
opts_chunk$set(echo=FALSE)
library(kableExtra)
options(knitr.table.format = "latex")
mx <- matrix(1:6, ncol=3) 
rownames(mx) <- LETTERS[1:NROW(mx)] 
colnames(mx) <- sprintf("Col %s", LETTERS[1:NCOL(mx)])
@

<<results='asis'>>=
kable(mx, booktabs = TRUE, caption = "My table", align = "c") %>% 
  add_header_above(c(" ", "First"=2, "Second"=1)) %>% 
    kable_styling(latex_options = "hold_position")
@

<<results='asis'>>=
kable(mx, booktabs = TRUE, caption = "My other table", align = "c") %>% 
  add_header_above(c(" ", "First"=2, "Second"=1)) %>% 
    kable_styling(latex_options = "hold_position") %>% 
  group_rows("Nice!", 1, 2)
@

\end{document}

enter image description here


1
通常我会做这样的事情:

tableLines <- print (xtable (mymatrix)) ## no file
multicolumns <- "& \\\\multicolumn{3}{c}{A} & \\\\multicolumn{3}{c}{B} \\\\\\\\"
tableLines <- sub ("\\\\toprule\\n", paste0 ("\\\\toprule\n", multicolumns, "\n"), tableLines) ## booktabs = TRUE
tableLines <- sub ("\\\\hline\\n",   paste0 ("\\\\hline\n",   multicolumns, "\n"), tableLines) ## booktabs = FALSE
writeLines (tableLines, con = "myfile")

请注意需要许多\\\\。反斜杠在subpaste命令中会丢失。

请注意,R 4.0的原始字符常量可以帮助减少反斜杠。 - Frank

0
有点晚了,但这是我的答案,与ashkan类似,但更通用,可以允许不同的参数。
首先,为什么要新回答?我需要一个没有表格环境的输出(我想在我的tex文档中编写标题等,而不是在我的r代码中),kableExtra似乎没有提供(如果我错了,请纠正我)。但我也希望输入具有灵活性(即,有或没有线条,不同的跨度等)。
结果是一个名为construct_header()的函数,它为我们构建标题。
首先是一个简短的例子:
library(xtable)
set.seed(123)
df <- matrix(round(rnorm(16), 2), ncol = 4) 
df <- cbind(paste("Var", 1:4), df)
colnames(df) <- c("Var", rep(c("X", "Y"), 2))
df
#      Var     X       Y       X       Y      
# [1,] "Var 1" "-0.56" "0.13"  "-0.69" "0.4"  
# [2,] "Var 2" "-0.23" "1.72"  "-0.45" "0.11" 
# [3,] "Var 3" "1.56"  "0.46"  "1.22"  "-0.56"
# [4,] "Var 4" "0.07"  "-1.27" "0.36"  "1.79" 

a_header <- construct_header(
  # the data.frame or matrix that should be plotted  
  df,
  # the labels of the groups that we want to insert
  grp_names = c("", "Group A", "Group B"), 
  # the number of columns each group spans
  span = c(1, 2, 2), 
  # the alignment of each group, can be a single character (lcr) or a vector
  align = "c"
)

print(xtable(df), add.to.row = a_header, include.rownames = F, hline.after = F)
# % latex table generated in R 3.4.2 by xtable 1.8-2 package
# % Fri Oct 27 16:39:44 2017
# \begin{table}[ht]
# \centering
# \begin{tabular}{lllll}
#   \hline
#   \multicolumn{1}{c}{} & \multicolumn{2}{c}{Group A} & \multicolumn{2}{c}{Group B} \\  \cmidrule(lr){2-3} \cmidrule(lr){4-5}
#   Var & X & Y & X & Y \\ 
#   \hline
#   Var 1 & -0.56 & 0.13 & -0.69 & 0.4 \\ 
#   Var 2 & -0.23 & 1.72 & -0.45 & 0.11 \\ 
#   Var 3 & 1.56 & 0.46 & 1.22 & -0.56 \\ 
#   Var 4 & 0.07 & -1.27 & 0.36 & 1.79 \\ 
#   \hline
# \end{tabular}
# \end{table}

请注意,我们必须指定 hline.after = FALSE (对我很重要,但这里省略的是指定 floating = FALSE 的可能性)。
这将导致此表格的结果(请注意,此方法需要在LaTeX中加载 booktabs 包):

table

您可以指定省略行 construct_header(..., draw_line = FALSE),对分组进行对齐,并以不同的方式跨越它们,即

ugly_header <- construct_header(df, c("One", "Two", "Three"), c(2, 1, 2), c("l", "c", "r"))
print(xtable(df), add.to.row = ugly_header, include.rownames = F, hline.after = F)

这导致了以下结果: 在此输入图像描述 该函数的代码如下:
#' Constructs a header i.e., groups for an xtable
#'
#' @param df a data.frame or matrix
#' @param grp_names the names of the groups
#' @param span where the groups span
#' @param align the alignment of the groups, defaults to center
#' @param draw_line if the group-names should be underlined
#'
#' @return a list that can be given to the \code{add.to.row} argument of the of \code{print.xtable}
#' @export
#'
#' @examples
#' library(xtable)
#' mx <- matrix(rnorm(16), ncol = 4) 
#' mx <- cbind(paste("Var", 1:4), mx)
#' colnames(mx) <- c("Var", rep(c("X", "Y"), 2))
#' 
#' addtorow <- construct_header(mx, c("", "Group A", "Group B"), span = c(1, 2, 2), "c")
#' print(xtable(mx), add.to.row = addtorow, include.rownames = F, hline.after = F)
construct_header <- function(df, grp_names, span, align = "c", draw_line = T) {
  if (length(align) == 1) align <- rep(align, length(grp_names))
  if (!all.equal(length(grp_names), length(span), length(align)))
    stop("grp_names and span have to have the same length!")

  if (ncol(df) < sum(span)) stop("Span has to be less or equal to the number of columns of df") 

  header <- mapply(function(s, a, grp) sprintf("\\multicolumn{%i}{%s}{%s}", s, a, grp),
                   span, align, grp_names)
  header <- paste(header, collapse = " & ")
  header <- paste0(header, " \\\\")

  if (draw_line) {
    # where do we span the lines:
    min_vals <- c(1, 1 + cumsum(span)[1:(length(span) - 1)])
    max_vals <- cumsum(span)
    line <- ifelse(grp_names == "", "", 
                   sprintf("\\cmidrule(lr){%i-%i}", min_vals, max_vals))
    line <- paste(line[line != ""], collapse = " ")

    header <- paste0(header, "  ", line, "\n  ")
  }

  addtorow <- list(pos = list(-1, -1, nrow(df)),
                   command = c("\\hline\n  ", header, "\\hline\n  "))
  return(addtorow)
}

1
我喜欢你的解决方案,但是我认为对于 '\cmidrule',我们需要添加使用 \usepackage{booktabs},不是吗? - Mario GS
没错,谢谢你指出来。我在答案中添加了这些信息。 - David

网页内容由stack overflow 提供, 点击上面的
可以查看英文原文,
原文链接