我希望您能够创建一个包含许多不同子表的 LaTeX 表格。我基本上想要生成一张包含调查答案的表格。
例如,第一个问题的表格如下:
第二个问题的表格如下:
我希望我的LaTeX输出看起来像这样:
例如,第一个问题的表格如下:
Q1 <- structure(c(6L, 14L, 20L, 15L, 2L, 3L, 12L, 25L, 7L, 1L, 2L,
13L, 35L, 10L, 3L), .Dim = c(5L, 3L), .Dimnames = structure(list(
    c("none", "very little", "some", "most", "all"), c("control",
    "treatment1", "treatment2")), .Names = c("", "")), class = "table")
第二个问题的表格如下:
Q2 <- structure(c(39L, 12L, 4L, 1L, 1L, 31L, 13L, 4L, 0L, 0L, 39L,
20L, 4L, 0L, 0L), .Dim = c(5L, 3L), .Dimnames = structure(list(
    c("A", "B+", "B", "B-", "C"), c("control", "treatment1",
    "treatment2")), .Names = c("", "")), class = "table")
我希望我的LaTeX输出看起来像这样:
我希望我的LaTeX输出看起来像这样:
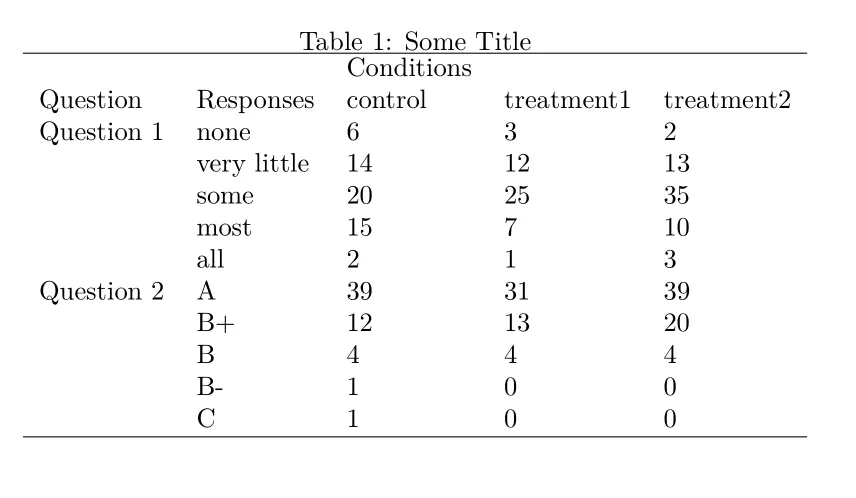
                    Some Title
                    Question 1
             control treatment1 treatment2
  none              6          3          2
  very little      14         12         13
  some             20         25         35
  most             15          7         10
  all               2          1          3
                    Question 2
  A                39         31         39
  B+               12         13         20
  B                 4          4          4
  B-                1          0          0
  C                 1          0          0
我可以使用X表格创建单独的表格,但这需要在Latex中进行一些手动工作才能合并它们。目前我的操作是:
print(xtable(Q1), floating = FALSE, only.contents = FALSE,
      include.rownames = TRUE, include.colnames = TRUE, hline.before = c(1))
rbind将表格合并成一个表,并在print(xtable())命令中使用add.to.row功能来包含中间标题(请参见此帖子以了解如何使用它)。为了居中显示中间标题,我建议使用multirow包的功能。上述提到的帖子中有一条评论解释了如何应用它。 - jmjr