在matplotlib的scatter3d函数中设置zlim

30
我在Python中有三个数据点列表xs,ys,zs,并且我正在尝试使用matplotlib的scatter3d方法创建一个3D图。
import matplotlib.pyplot as plt

fig = plt.figure()  
ax = fig.add_subplot(111, projection='3d')  
plt.xlim(290)  
plt.ylim(301)  
ax.set_xlabel('X')
ax.set_ylabel('Y')
ax.set_zlabel('Z')
ax.scatter(xs, ys, zs)  
plt.savefig('dateiname.png')
plt.close()
plt.xlim()plt.ylim()的功能很好,但是我找不到一个函数来设置z方向的边界。我该如何做呢?
1个回答

46
只需使用axes对象的set_zlim函数(就像您已经使用set_zlabel一样,它也不可用作plt.zlabel):
import matplotlib.pyplot as plt
import numpy as np

xs = np.random.random(10)
ys = np.random.random(10)
zs = np.random.random(10)

fig = plt.figure()  
ax = fig.add_subplot(111, projection='3d')  
ax.set_xlabel('X')
ax.set_ylabel('Y')
ax.set_zlabel('Z')
ax.scatter(xs, ys, zs)  
ax.set_zlim(-10, 10)

enter image description here


14
为什么
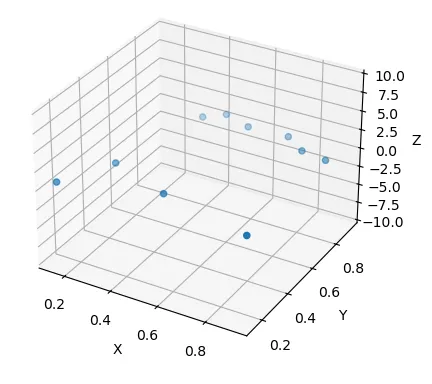
plt.zlim没有被实现?如果有的话,将使mpl更加一致,人们就不必在这里提出这个问题了。 - Soren
@Sören。3D 绘图是一种扩展功能。话虽如此,我并没有看到为什么不能让相关的导入设置在 plt 命名空间中增加一个附加函数的理由。 - Mad Physicist

网页内容由stack overflow 提供, 点击上面的
可以查看英文原文,
原文链接