在Matplotlib的PatchCollection中设置颜色范围

18
我正在使用matplotlib绘制一个
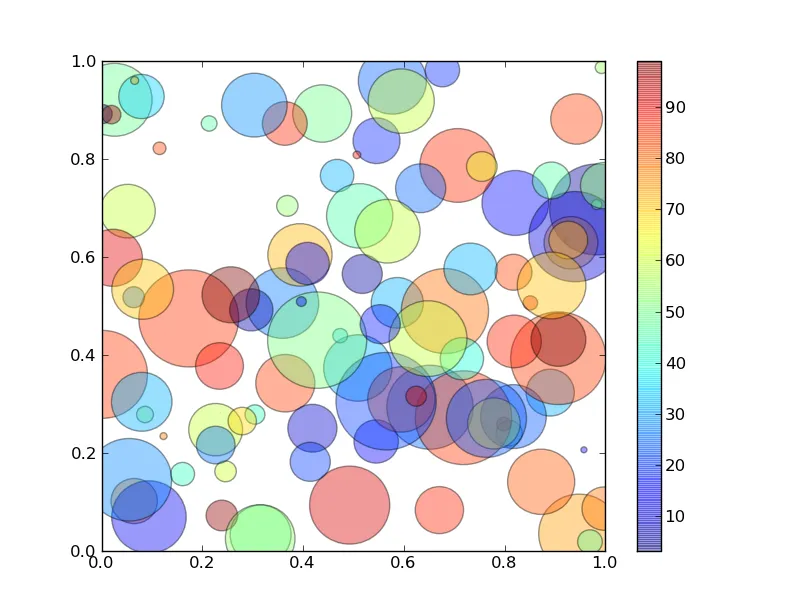
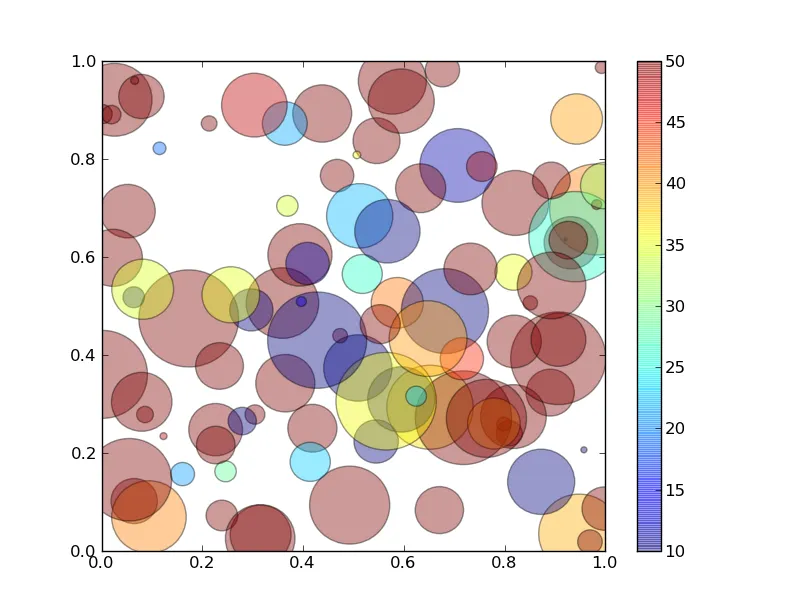
PatchCollection,其中的坐标和补丁颜色值从文件中读取。问题在于,matplotlib似乎会自动将颜色范围缩放到数据值的最小/最大值。如何手动设置颜色范围?例如,如果我的数据范围是10-30,但我想将其缩放到5-50的颜色范围(例如,与另一个图形进行比较),我该怎么做呢?我的绘图命令看起来与api示例代码非常相似:patch_collection.py
colors = 100 * pylab.rand(len(patches))
p = PatchCollection(patches, cmap=matplotlib.cm.jet, alpha=0.4)
p.set_array(pylab.array(colors))
ax.add_collection(p)
pylab.colorbar(p)

pylab.show()
1个回答

40

使用p.set_clim([5, 50])可以设置颜色缩放的最小值和最大值,在您的示例中。Matplotlib中任何具有颜色地图的内容都具有get_climset_clim方法。

完整示例:

import matplotlib
import matplotlib.pyplot as plt
from matplotlib.collections import PatchCollection
from matplotlib.patches import Circle
import numpy as np

# (modified from one of the matplotlib gallery examples)
resolution = 50 # the number of vertices
N = 100
x       = np.random.random(N)
y       = np.random.random(N)
radii   = 0.1*np.random.random(N)
patches = []
for x1, y1, r in zip(x, y, radii):
    circle = Circle((x1, y1), r)
    patches.append(circle)

fig = plt.figure()
ax = fig.add_subplot(111)

colors = 100*np.random.random(N)
p = PatchCollection(patches, cmap=matplotlib.cm.jet, alpha=0.4)
p.set_array(colors)
ax.add_collection(p)
fig.colorbar(p)

fig.show()

enter image description here

现在,我们只需要在调用 fig.show(...) 之前添加代码 p.set_clim([5, 50])(其中 p 是补丁集合),就可以得到下面这个图像: enter image description here


网页内容由stack overflow 提供, 点击上面的
可以查看英文原文,
原文链接