对齐太阳的图像 - 但它们在漂移

3
我一直在对200多张连续拍摄的太阳图片进行对齐,以便以后进行分析。
我以为我已经成功了,但是当我播放所有图片的视频时,我注意到太阳向下漂移。我认为这是因为在某些图片中,没有完整的太阳盘,因此我通过“质心”对齐它们的方式有些错误。
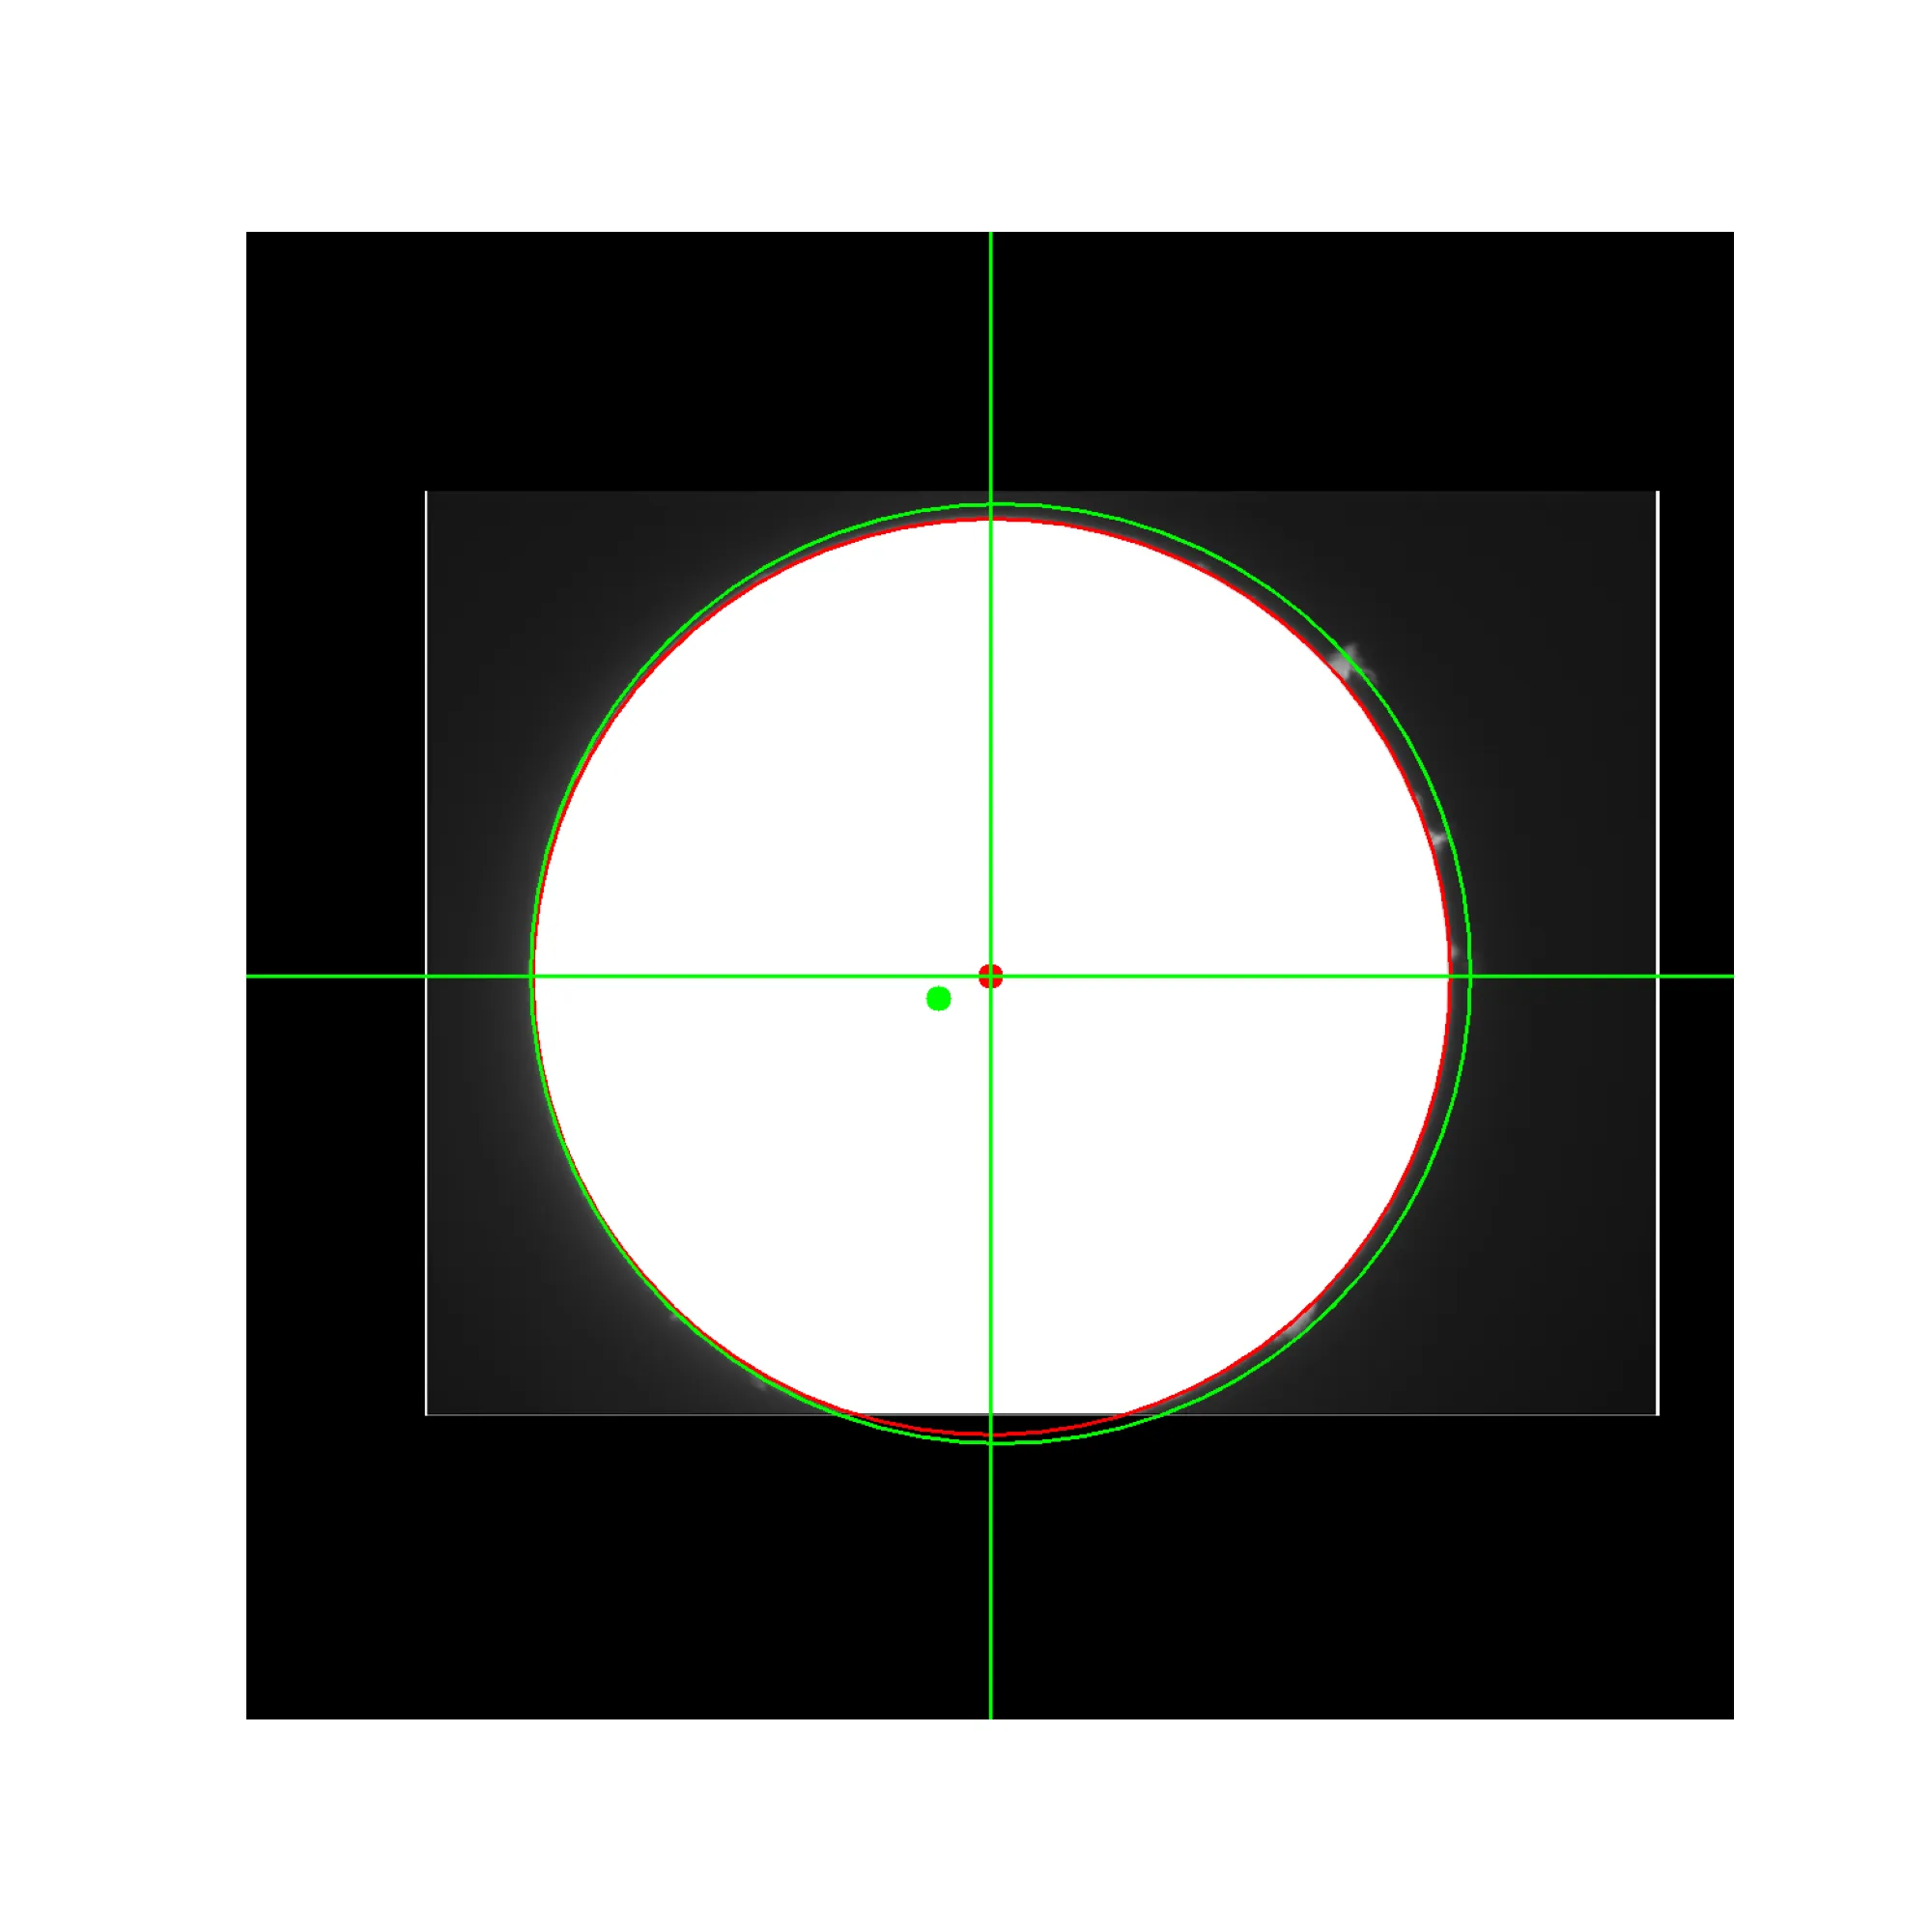
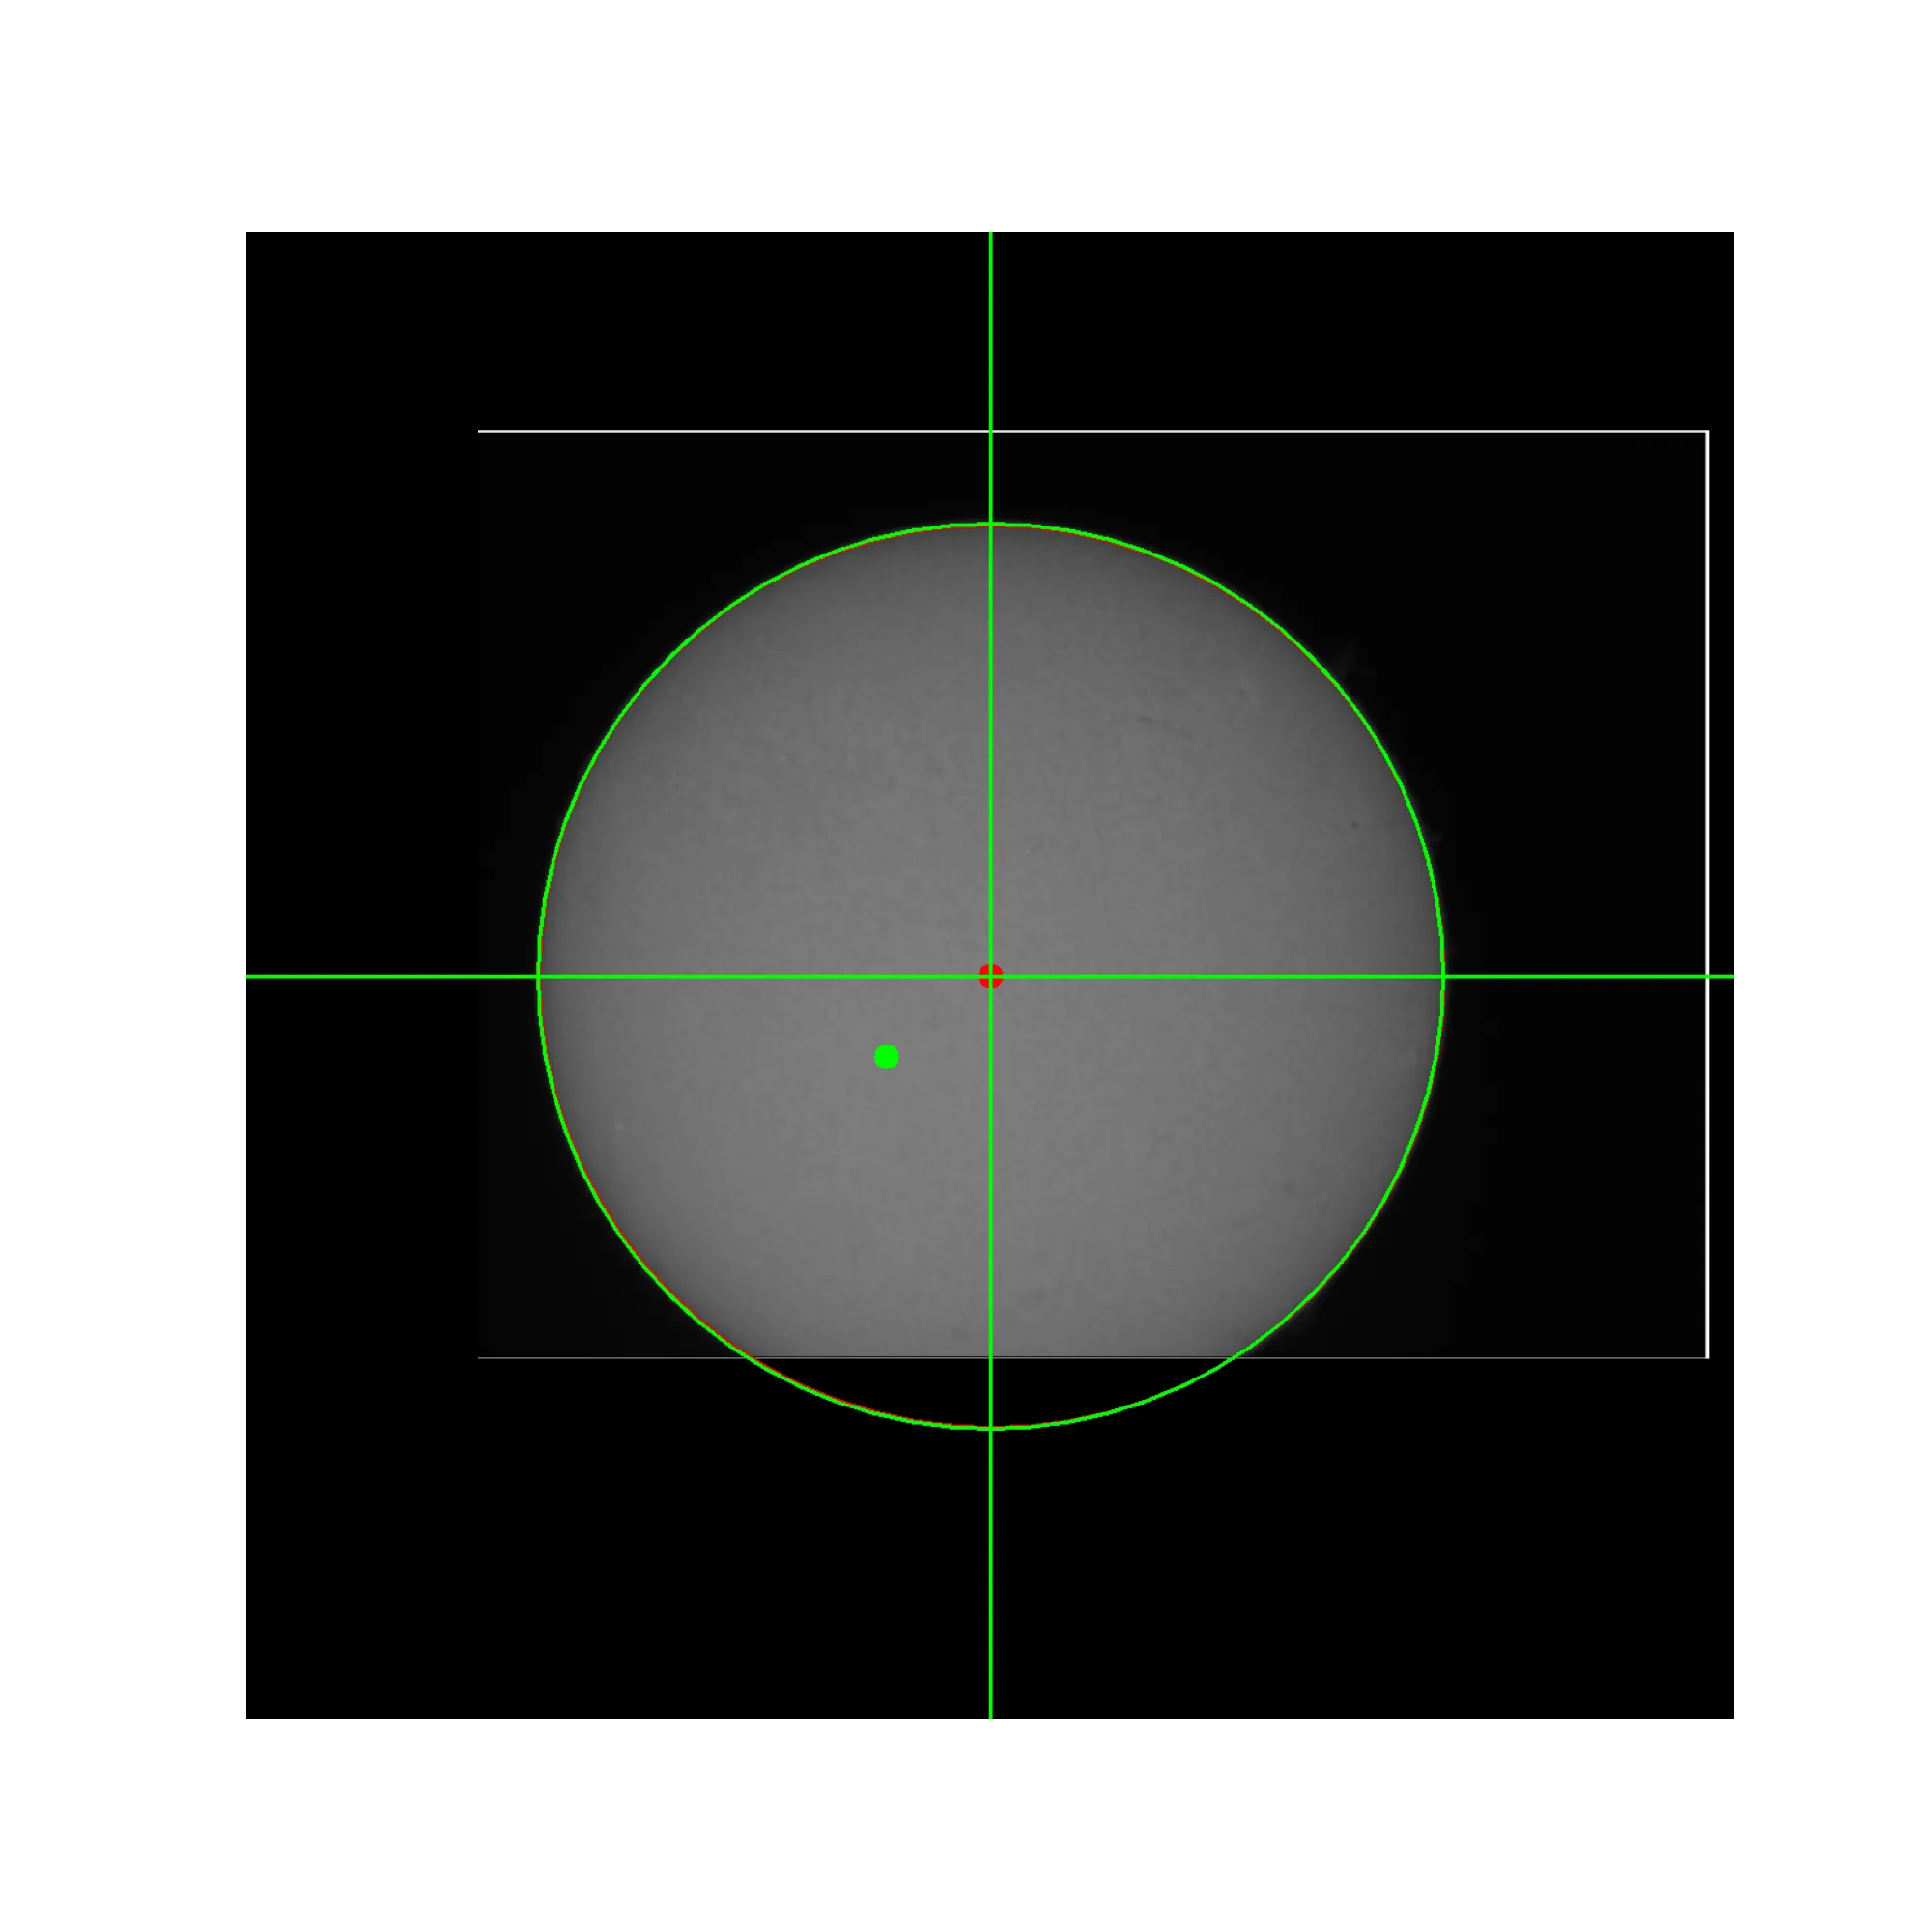
以下是我所说的漂移的一些示例: 太阳处于正确位置的第一张图片 我试图对齐图片时太阳漂移的最终图片 
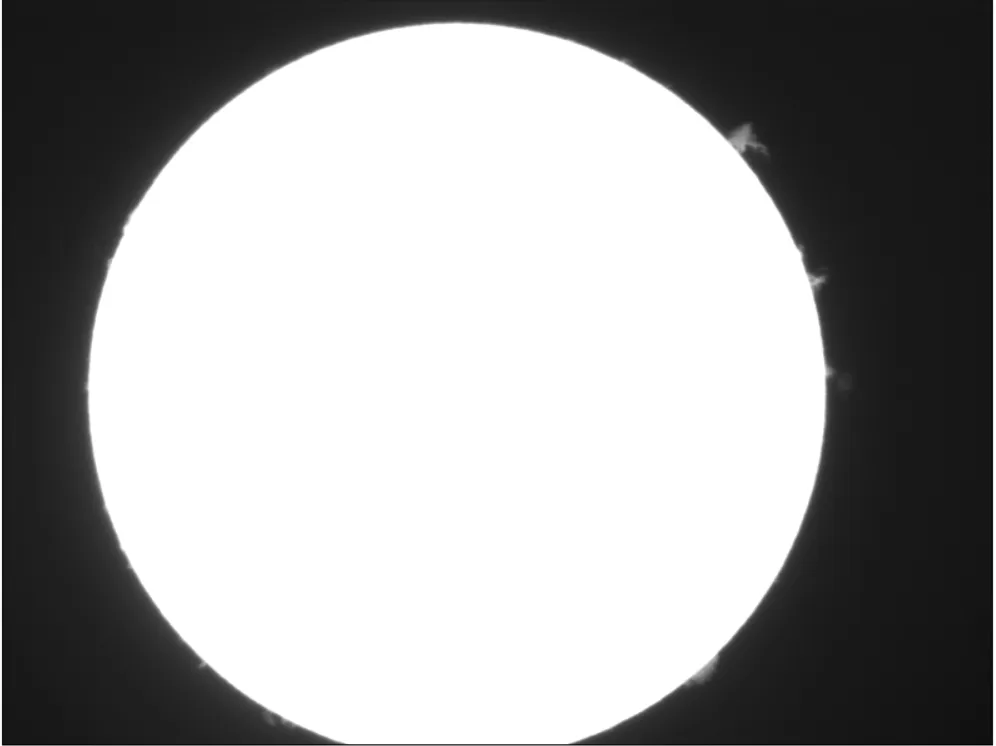
我认为这种漂移是由于我如何找到每个圆盘的质心 - 由于每个FITS图像中都没有完整的圆盘,质心会慢慢移动到不同的位置,从而导致对齐出现偏斜。
我用的代码在这里:
def get_centroid(data): 
    #data is extracted from a FITS file
    
    #getting data centroid
    y_index, x_index = np.where(data >= 1e4) 
    #threshold is set to only include bright circle (sun) and not background

    #calculate the centroid
    centroid_y = np.mean(y_index)
    centroid_x = np.mean(x_index)
    
    return(centroid_y, centroid_x) 

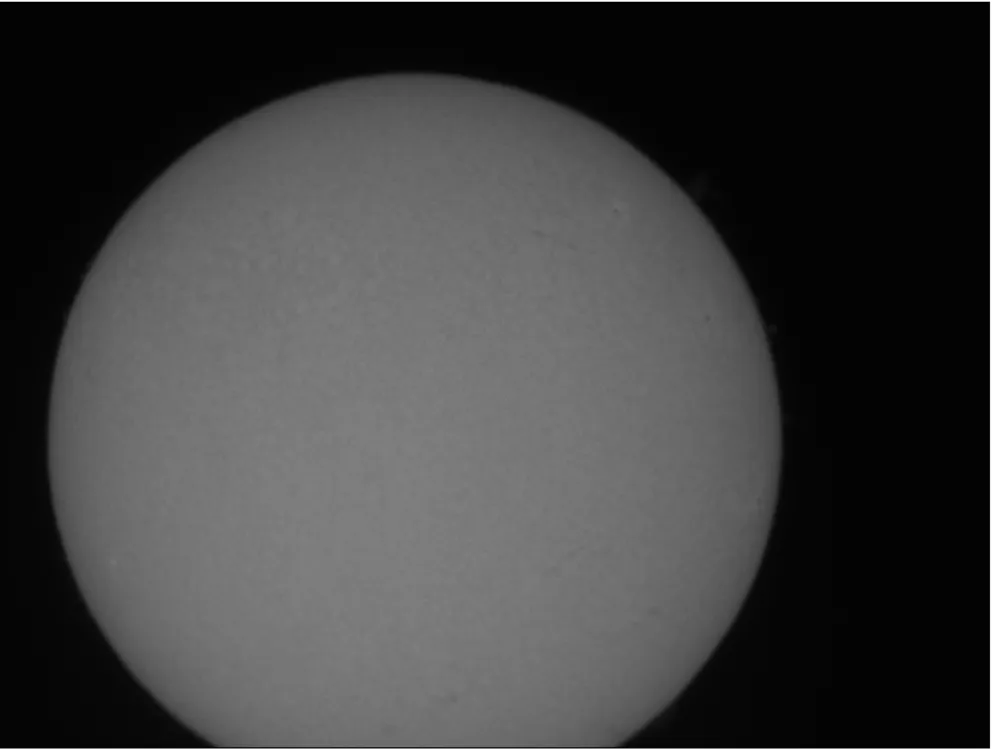
我意识到只有当完整的圆圈存在时,这才有效 - 在我的一些图像中,太阳盘的部分被切断了。
我正在努力编辑我的函数,以便如果x轴或y轴中的一个较短(即如果圆圈的一部分被切断),我可以调整索引,使其好像完整的圆圈在那里 - 这样我的质心就真正成为圆圈的中心,我可以继续对齐。
提前感谢。

你能告诉我们数据在图表中是什么样子吗?它是一个轮廓还是圆内的点? - undefined
3
目前我唯一的想法是将一个圆形拟合到你的数据上,并计算出拟合圆的中心。这样可以弥补缺失的数据。 - undefined
1
有很多简单的方法可以用来对齐这些图像。例如,提取轮廓并使用RANSAC算法来对齐它们。但是,像Marco建议的那样,对每个图像分别拟合一个圆也是一个非常好的主意。 - undefined
@MarcoF。数据来自FITS图像,因此是带有坐标和强度的numpy数组 - 所以我认为这意味着圆内的点。我在函数中设置的1e4的阈值值选择了太阳盘上的点(因为强度低于此值的是黑色背景)。 - undefined
1
如果它总是在同一侧被切断,你可以借助边界(ymin/ymax和xmin/xmax)来计算中心点。你可以计算宽度,然后用它来计算高度的中心点。 - undefined
1
根据需要调整您的图像大小。然后使用HoughCircles()或fitEllipse来识别太阳圆形。 - undefined
1个回答

2
希望这对你有所帮助。我使用了OpenCV: Fitting a single circle to an image (in Python)中提到的想法。对于回答的冗长,我表示抱歉。
首先,让我们创建一个更大的画布,这样我们稍后可以将太阳图像居中。
import cv2 as cv
import matplotlib.pyplot as plt
import numpy as np

img1 = cv.imread('6cTxW.png')
img2 = cv.imread('CVxDC.png')

def image_inside_larger_canvas(img,size):
    # Define the size of the larger canvas
    larger_canvas_size = size  # Change the dimensions as needed

    # Create a larger canvas of the specified size
    larger_canvas = np.zeros((larger_canvas_size[1], larger_canvas_size[0], 3), dtype=np.uint8)

    # Calculate the position to place the image in the center of the larger canvas
    x_offset = (larger_canvas_size[0] - img.shape[1]) // 2
    y_offset = (larger_canvas_size[1] - img.shape[0]) // 2

    # Paste the image onto the larger canvas
    larger_canvas[y_offset:y_offset + img.shape[0], x_offset:x_offset + img.shape[1]] = img

    return larger_canvas

现在是图像处理部分,解释在代码内部。
#create a larger canvas
img1_larger = image_inside_larger_canvas(img2,(1200,1200))

#convert to gray
img1_gray = cv.cvtColor(img1_larger, cv.COLOR_BGR2GRAY)

#binarization so we can fit the countours
th_val,binarized1 = cv.threshold(img1_gray,1,255,cv.THRESH_OTSU)

# this part will get you the outer shape of the sun, in
# other words, the perimeter (also called morph gradient)
kernel = cv.getStructuringElement(cv.MORPH_ELLIPSE,(5,5))
binarized1_eroded = cv.erode(binarized1,kernel)
gradient = binarized1 - binarized1_eroded

#finding countours and finding the biggest area
contours,_ = cv.findContours(gradient,cv.RETR_TREE,cv.CHAIN_APPROX_SIMPLE)
areas = [cv.contourArea(c) for c in contours]
sorted_areas = np.sort(areas)

#choosing the one with the biggest area
cnt = contours[areas.index(sorted_areas[-1])]

# fit circle
(x,y),radius = cv.minEnclosingCircle(cnt)
center = (int(x),int(y))
radius = int(radius)

# fit ellipse (blue)
ellipse = cv.fitEllipse(cnt)

(ellipse_center, axes, angle) = ellipse

# Get ellipse center for later use
x_c,y_c = int(ellipse_center[0]), int(ellipse_center[1])

#change to RGB so we can plot the fitted ellipses and circles
img1_gray = cv.cvtColor(img1_gray, cv.COLOR_GRAY2RGB)

# draw ellipse and circle to see the process
# you can remove this later.
cv.ellipse(img1_gray,ellipse,(255,0,0),2)
cv.circle(img1_gray,center,radius,(0,255,0),2)

# Draw a dot also
_ = cv.circle(img1_gray, (x_c,y_c), 10, (255, 0, 0), -1)

现在你只需要将太阳翻译到画布的中心。这可以通过使用T矩阵的warpAffine函数来完成,该函数使用椭圆中心与画布中心的距离。
height, width = img1_gray.shape[:2] 

#get the middle of the canvas
middle_h, middle_w = height // 2, width // 2

# the matrix tarfomation
T = np.float32([[1, 0, middle_w-x_c], [0, 1, middle_h-y_c]]) 

# use warpAffine to transform the image using the matrix, T 
img_translation = cv.warpAffine(img1_gray, T, (width, height)) 

# Draw a horizontal line on the canvas to check if it is in the middle.
line = img_translation.shape[1] // 2
cv.line(img_translation, (0, line), (img_translation.shape[0], line), (0, 255, 0), 2) 
cv.line(img_translation, (line, 0), (line, img_translation.shape[0]), (0, 255, 0), 2)

# Draw a dot on the canvas
cv.circle(img_translation, (np.abs(x_c), np.abs(y_c)), 10, (0, 255, 0), -1)

plt.figure(figsize=(20,20))
plt.imshow(img_translation)
plt.axis('off')
plt.savefig('dale1.png')
plt.show()

绿点是旧的太阳中心,红圈是椭圆,绿圈是圆形,绿线是图像中心线。

enter image description here

enter image description here


我唯一的问题是,使用OpenCV能否处理FITS文件 - 我在处理它们作为图像时遇到了一些问题。否则,非常感谢您详细的回复! - undefined
嘿 @SevHryn,我快速通过谷歌搜索找到了一些信息:链接1如果你能使用C++,这是链接2。OpenCV可以处理float32类型的图像,只需确保其数值范围在0-1之间。但如果遇到问题,可以将图像转换为uint8类型,然后可以使用OpenCV创建二进制掩模,并将其应用于你的FITS图像。 - undefined

网页内容由stack overflow 提供, 点击上面的
可以查看英文原文,
原文链接