使用Photoshop或R将耦合显微镜/光谱学的图像和数据拼接成全景图。

17
我有一组由扫描电子显微镜和能量色散光谱生成的图像和X射线数据。这是我的问题:
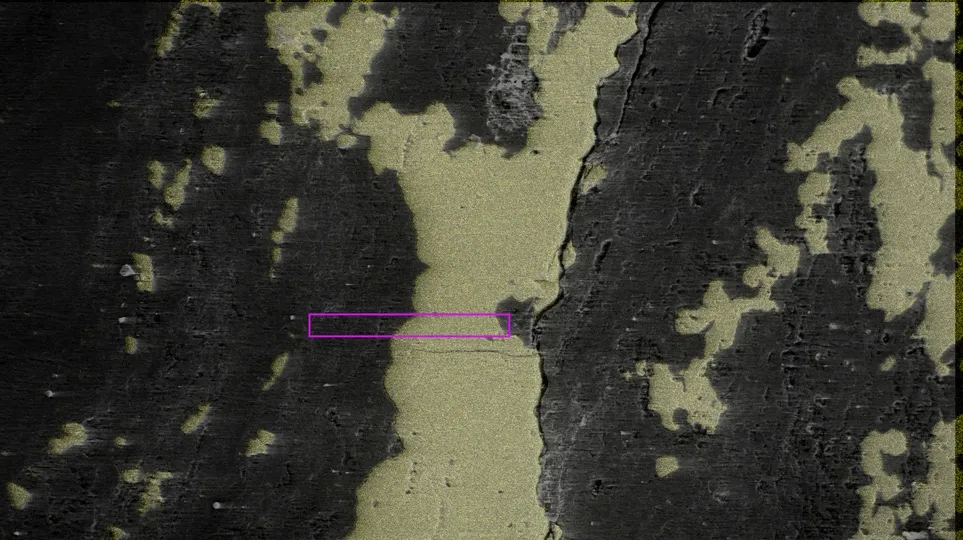
我像这样对岩石表面进行了横截面成像(紫色框勾画了横截面区域):

enter image description here

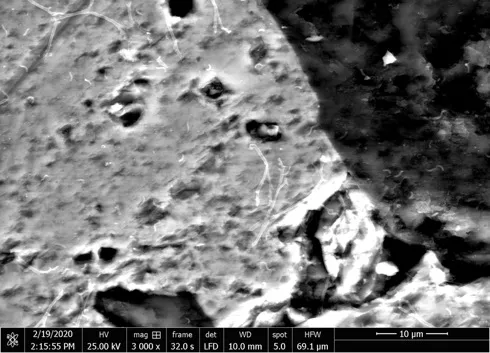
我想要非常高的分辨率,所以我使用了7张3000倍放大的图像,并使用Photoshop中的photomerge脚本将它们拼接在一起。这是一个单独图像的示例:

enter image description here

并且它在照片合成图像横截面中的位置:

enter image description here

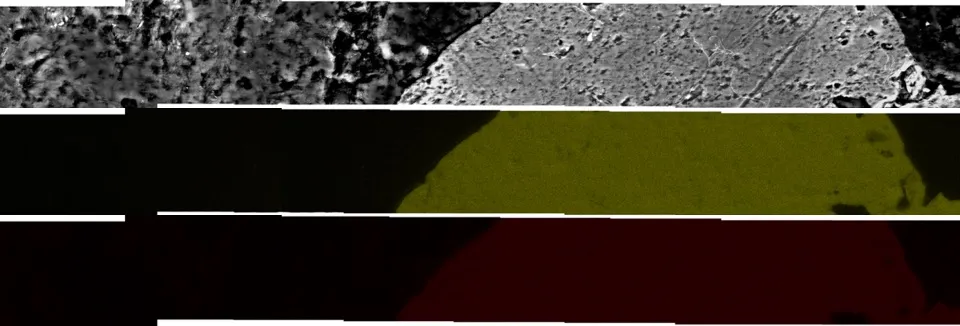
在这7个位置,我还收集了X射线数据,生成每个检测到的元素的元素图,并将其写入TIFF。我还想将每个元素图TIFF拼接在一起,以便可以将其叠加在岩石的合并横断面图像上。这是我想要的结果:

enter image description here

问题在于元素地图中没有足够的特征来使用photomerge将它们拼接在一起。这基本上是二进制的——如果检测到一个元素,像我的示例图像中的铁为红色或者硫为黄色,否则为黑色。你可以看到,元素地图中有大片区域是黑色的。

现在我有大约20个横截面x每个7张图像x大约10个元素,共计大约1400张需要拼接的图像,因此需要自动化处理。

我的想法是使用photomerge将岩石图像拼接在一起。photomerge的输出是一个智能对象,其中每个图像都是一个图层。然后,我会使用脚本获取photomerged图像对象中每个7个图像的左上角坐标、宽度和高度。然后,我将把这些属性放置并分配给对应的7个元素地图中的每个图像,以生成要叠加在图像上的“合并”元素地图。我尝试过自己解决这个问题,但我不精通JavaScript,也无法理解Photoshop API。

我在Github上上传了一个示例数据集here。从左到右,7个横截面位置为-2、-1、0、1、2、3、4。有岩石图像和每个位置的元素数据的子目录。


2
嗨@Caitlin,我不太明白你需要什么样的结果?是一个包含所有图层的Photoshop文件吗?还是一组导出的图像(每个图像都位于正确的位置)? - mdomino
2
@Caitlin 已批准!! - Nosniw
5
好的,我明白了。你想问一下,是否有一种方法可以在不使用Photoshop的情况下实现这一点。但如果最终需要将所有文件放入Photoshop中,则必须在Photoshop中完成。过去我编写了很多ExtendScript脚本,我必须说,你所要求的可能太大了,在Stack Overflow上解决这个问题可能比较困难。基本上你正在要求一个完整的脚本,通常需要为此雇用某人。因为你需要按名称加载文件,将它们排列在正确的图层上,通过坐标定位它们等等。这相当复杂。 - mdomino
2
这是另一篇关于StackOverflow的博客文章,不幸的是,它将其与斯坦福监狱实验进行了比较。@Caitlin听起来你只是在寻找针对这个问题的Photoshop脚本解决方案? - Codebling
1
@Caitlin 我明白,但如果有人有另一种合并图层的替代方法,那么这是否可行? - Codebling
显示剩余17条评论
2个回答

6

我不懂 Photoshop 或 R,所以用 JavaScript 完成了这个任务:

const names = { // map from directory names to patterns (where "#" stands for position index) of names of images therein
 "SEM_images" : "pos# image.tif",
 "Al" : "Al Kα1 pos# map data.tif",
 "Ba" : "Ba Lα1 pos# map data.tif",
 "C"  : "C Kα1_2 pos# map data.tif",
 "Ca" : "Ca Kα1 pos# map data.tif",
 "Fe" : "Fe Kα1 pos# map data.tif",
 "Hg" : "Hg Lα1 pos# map data.tif",
 "Ir" : "Ir Lα1 pos# map data.tif",
 "K"  : "K Kα1 pos# map data.tif",
 "Mg" : "Mg Kα1_2 pos# map data.tif",
 "Mn" : "Mn Kα1 pos# map data.tif",
 "Na" : "Na Kα1_2 pos# map data.tif",
 "O"  : "O Kα1 pos# map data.tif",
 "Os" : "Os Lα1 pos# map data.tif",
 "P"  : "P Kα1 pos# map data.tif",
 "S"  : "S Kα1 pos# map data.tif",
 "Si" : "Si Kα1 pos# map data.tif",
 "Ti" : "Ti Kα1 pos# map data.tif"
}

const SCALE = 1/10 // scale of output images

const OVERLAP = 1.0 // minimum *tested* (horizontal) overlap of images relative to their width
const H_BOX = 0.1 // height of comparison box relative to height of images
const W_BOX = 0.1 // width  of comparison box relative to width  of images
const ADJUSTMENT = 0 // (vertical) adjustment of comparison box [pixels]

/* Merge images given:
 * dataset - dataset address as String
 * directory - directory name for images as String
 * pattern - pattern (where "#" stands for position index) of names of images in directory
 * pos_min - minimum position index of images as Number
 * pos_max - maximum position index of images as Number
 */
function Merge(dataset, directory, pos_min, pos_max) {
  if (dataset[dataset.length - 1] != "/") dataset += "/"
  const images = []
  for (let pos = pos_min; pos <= pos_max; ++pos) (images[pos - pos_min] = new Image).src = dataset + directory + "/" + names[directory].replace("#", pos)
  merge(images, dataset, pos_min, pos_max)
}

function Laplacian(imagedata) { // 5-point stencil approximation
  const data = imagedata.data
  const L = data.length/4
  const grayscale = new Float32Array(L)
  for (let i = 0; i < L; ++i) {
    const I = 4*i
    grayscale[i] = (data[I    ] + data[I + 1] + data[I + 2])/3
  }
  const Laplacian = new Float32Array(L)
  //const H = imagedata.height
  const Hm1 = imagedata.height - 1
  const W = imagedata.width
  const Wm1 = W - 1
  for (let r = 1; r < Hm1; ++r) {
    const R = r*W
    for (let c = 1; c < Wm1; ++c) {
      const i = R + c
      Laplacian[i] = grayscale[i - W] + grayscale[i + W] + grayscale[i - 1] + grayscale[i + 1] - 4*grayscale[i]
    }
  }
  for (let c = 1; c < Wm1; ++c) {
    //const i = c
    Laplacian[c] = grayscale[c + W] + grayscale[c - 1] + grayscale[c + 1] - 4*grayscale[c]
  }
  for (let c = 1; c < Wm1; ++c) {
    const i = Hm1*W + c
    Laplacian[i] = grayscale[i - W] + grayscale[i - 1] + grayscale[i + 1] - 4*grayscale[i]
  }
  for (let r = 1; r < Hm1; ++r) {
    const i = r*W
    Laplacian[i] = grayscale[i - W] + grayscale[i + W] + grayscale[i + 1] - 4*grayscale[i]
  }
  for (let r = 1; r < Hm1; ++r) {
    const i = r*W + Wm1
    Laplacian[i] = grayscale[i - W] + grayscale[i + W] + grayscale[i - 1] - 4*grayscale[i]
  }
  {
    const Lm1 = L - 1
    const LmW = L - W
    Laplacian[0  ] = grayscale[W      ] + grayscale[1      ] - 4*grayscale[0  ]
    Laplacian[W  ] = grayscale[2*W    ] + grayscale[Wm1    ] - 4*grayscale[W  ]
    Laplacian[LmW] = grayscale[LmW - W] + grayscale[LmW + 1] - 4*grayscale[LmW]
    Laplacian[Lm1] = grayscale[Lm1 - W] + grayscale[Lm1 - 1] - 4*grayscale[Lm1]
  }
  return Laplacian
}

function merge(images, dataset, pos_min, pos_max) {
  for (const image of images) if (!image.complete) {
    setTimeout(merge, 1000, images, dataset, pos_min, pos_max) // wait 1000ms = 1s
    return
  }
  let Row, Col
  const Coords = [[Row = 0, Col = 0]]
  let index = 0
  let image = images[index]
  const H = image.naturalHeight
  const W = image.naturalWidth
  if (W*H == 0) return []
  const canvas = document.createElement("canvas")
  canvas.height = H
  canvas.width  = W
  const context = canvas.getContext('2d')
  context.drawImage(image, 0, 0)
  let prev = Laplacian(context.getImageData(0, 0, W, H))
  const length = images.length
  const h = Math.round(H_BOX*H)
  const Hmh = H - h
  const w = Math.round(W_BOX*W)
  const o = Math.max(Math.round((1 - OVERLAP)*W), w)
  const Wmw = W - w
  const row_offset = Math.round(Hmh/2) + ADJUSTMENT
  const offset = row_offset*W
  for (++index; index < length; ++index) {
    image = images[index]
    if (image.naturalHeight != H || image.naturalWidth != W) alert("Dimension mismatch: " + image.src)
    context.drawImage(image, 0, 0)
    const curr = Laplacian(context.getImageData(0, 0, W, H))
    let max = -1
    let row, col
    for (let r = 0; r < Hmh; ++r) {
      const R = r*W
      for (let c = o; c < Wmw; ++c) {
        let m = 0
        for (let i = 0; i < h; ++i) {
          const I = i*W
          const K = R + I + c
          const k = offset + I
          for (let j = 0; j < w; ++j) if (prev[K + j]*curr[k + j] > 0) ++m
        }
        if (m > max) {
          max = m
          row = r
          col = c
        }
      }
    }
    Coords[index] = [(Row += row - row_offset)/H, (Col += col)/W]
    prev = curr
  }
  Stitch(dataset, pos_min, pos_max, Coords)
}

function Stitch(dataset, pos_min, pos_max, Coords) {
  if (dataset[dataset.length - 1] != "/") dataset += "/"
  document.body.appendChild(document.createElement("h1")).innerText = `${dataset} :[${pos_min},${pos_max}] @${JSON.stringify(Coords)}`
  const tasks = []
  for (const directory in names) {
    document.body.appendChild(document.createElement("h2")).innerText = directory
    const images = []
    for (let pos = pos_min; pos <= pos_max; ++pos) (images[pos - pos_min] = new Image).src = dataset + directory + "/" + names[directory].replace("#", pos)
    const target = document.body.appendChild(document.createElement("img"))
    target.height = 0
    target.width  = 0
    tasks.push([images, target])
  }
  process(tasks, Coords)
}

const ROW = 0
const COL = 1
function stitch(images, Coords) {
  let image
  let index
  for (index in images) {
    image = images[index]
    if (image.naturalHeight != 0 && image.naturalWidth != 0) break
  }
  const H = image.naturalHeight
  const W = image.naturalWidth
  const canvas = document.createElement("canvas")
  let r_min = 0
  let r_max = 0
  let c_min = 0
  let c_max = 0
  for (coords of Coords) {
    const r = coords[ROW]
    const c = coords[COL]
    if (r < r_min) r_min = r
    if (r > r_max) r_max = r
    if (c < c_min) c_min = c
    if (c > c_max) c_max = c
  }
  canvas.height = (r_max - r_min + 1)*H
  canvas.width  = (c_max - c_min + 1)*W
  const context = canvas.getContext('2d')
  if (context == null) {
    let list = ""
    for (const image of images) list += "\n- " + image.src
    alert("Too large: stitching area required for:" + list)
    return
  }
  let coords = Coords[index]
  let row = (coords[ROW] - r_min)*H
  let col = (coords[COL] - c_min)*W
  context.drawImage(image, col, row)
  const length = images.length
  for (++index; index < length; ++index) {
    image = images[index]
    if (image.naturalHeight == 0 || image.naturalWidth == 0) continue
    if (image.naturalHeight != H || image.naturalWidth != W) alert("Dimension mismatch: " + image.src)
    coords = Coords[index]
    row = coords[ROW]*H
    col = coords[COL]*W
    context.drawImage(image, col, row)
  }
  return canvas.toDataURL()
}

function process(tasks, Coords) {
  const task = tasks.shift()
  const images = task[0]
  for (const image of images) if (!image.complete) {
    tasks.push(task)
    setTimeout(process, 1000, tasks, Coords) // wait 1000ms = 1s
    return
  }
  const target = task[1]
  target.src = stitch(images, Coords)
  target.onload = function () {
    this.height = SCALE*this.naturalHeight
    this.width  = SCALE*this.naturalWidth
    this.style = "border: solid black 1px"
  }
  if (tasks.length > 0) process(tasks, Coords)
}

要运行,可以像这样做:

Merge("https://raw.githubusercontent.com/CaitlinCasar/dataStitcher/master/example_dataset/", "SEM_images", -2, 4)

带有Fe覆盖层的SEM图像示例: 带有Fe覆盖层的SEM图像


您可能需要禁用跨域限制。 - greg-tumolo

0
很希望能够完全使用Photoshop脚本或完全使用R来完成这个任务,但我有一个使用两者的工作解决方案。我手动从Photoshop的photomerge输出中提取了每个图层左下角的XY坐标,并将它们分配给了R中的光栅图像。
#!/usr/bin/env Rscript

#Caitlin Casar
#github.com/caitlincasar
#19 March 2020
#DataStitchR stitches panoramic images of SEM images coupled to x-ray energy dispersive spectroscopy.

# usage: ./dataStitchR. -f "/Users/Caitlin/Desktop/dataStitcher/example_dataset" -b "/Users/Caitlin/Desktop/dataStitcher/example_dataset/SEM_images" -c "/Users/Caitlin/Desktop/dataStitcher/coordinates.txt" -z ".tif" -m ".tif" -a "Unknown|Os|SEM" -d "overview" -y "overview" -p TRUE -o "example" -n "example"
# usage Rscript dataStitchR.R -f "/Users/Caitlin/Desktop/dataStitcher/example_dataset" -b "/Users/Caitlin/Desktop/dataStitcher/example_dataset/SEM_images" -c "/Users/Caitlin/Desktop/dataStitcher/coordinates.txt" -z ".tif" -m ".tif" -a "Unknown|Os|SEM" -d "overview" -y "overview" -p TRUE -o "example" -n "example"

message("
                                        #####                                    ######  
        #####     ##    #####    ##    #     #  #####  #  #####   ####   #    #  #     # 
        #    #   #  #     #     #  #   #          #    #    #    #    #  #    #  #     # 
        #    #  #    #    #    #    #   #####     #    #    #    #       ######  ######  
        #    #  ######    #    ######        #    #    #    #    #       #    #  #   #   
        #    #  #    #    #    #    #  #     #    #    #    #    #    #  #    #  #    #  
        #####   #    #    #    #    #   #####     #    #    #     ####   #    #  #     # 
        

        ")

message("DataStitchR was created by Caitlin Casar and is maintained at github.com/CaitlinCasar/dataStitchR.
        ")
message("DataStitchR stitches panoramic images of SEM images coupled to x-ray energy dispersive spectroscopy.
        ")
message("For help, run 'dataStitchR.R --help'.
        
        
        ")

suppressPackageStartupMessages(require(optparse))

option_list = list(
  make_option(c("-f", "--file"), action="store", default=getwd(), type='character',
              help="Input parent directory with subdirectories of element xray data to be stitched. The element names should be abbreviated, i.e. 'Ca' for calcium."),
  make_option(c("-o", "--out"), action="store", default=NA, type='character',
              help="Output file directory. This is where your x-ray raster brick and output figures will be saved."),
  make_option(c("-n", "--name"), action="store", default=NA, type='character',
              help="Optional name for output files."),
  make_option(c("-b", "--base-images"), action="store", default=NA, type='character',
              help="SEM image file directory."),
  make_option(c("-c", "--coords"), action="store", default=NA, type='character',
              help="Tab-delimited file of xy coordinates for each image. A third column should denote stitching positions that correspond to the file names for each image."),
  make_option(c("-u", "--use-positions"), action="store", default="-?(?<![Kα1||Kα1_2])\\d+", type='character',
              help="Optional regex pattern to extract position IDs from each file name that corresponds to positions in the xy file. The default searches for numbers that appear after 'Kα1' or 'Kα2'. Numbers can include signs, i.e. -1 is acceptable."),
  make_option(c("-z", "--z-format"), action="store", default="*", type='character',
              help="Optional regex pattern of x-ray image formats to select for stitching, i.e. '.tif'."),
  make_option(c("-m", "--make"), action="store", default="*", type='character',
              help="Optional regex pattern of SEM image formats to select for stitching, i.e. '.tif'. You do not need to specify this unless you are generating a PDF output."),
  make_option(c("-a", "--all-exclude"), action="store", default=NA, type='character',
              help="Optional regex pattern of x-ray file directories to exclude from stitiching, i.e. the element your sample was coated with."),
  make_option(c("-d", "--drop"), action="store", default=NA, type='character',
              help="Optional regex pattern of files to exclude from x-ray data stitching."),
  make_option(c("-y", "--y-exclude"), action="store", default=NA, type='character',
              help="Optional regex pattern of files to exclude from SEM image stitiching. You do not need to specify this unless you are generating a PDF output."),
  make_option(c("-v", "--verbose"), action="store_true", default=TRUE,
              help="Print updates to console [default %default]."),
  make_option(c("-q", "--quiet"), action="store_false", dest="verbose",
              help="Do not print anything to the console."),
  make_option(c("-p", "--pdf"), action="store", default=FALSE,
              help="Generate PDF of x-ray brick colored by element superimposed on the SEM image, default is TRUE [default %default].")  
)
opt = parse_args(OptionParser(option_list=option_list))


#load dependencies 
suppressPackageStartupMessages(require(pacman))
pacman::p_load(raster, magick, tidyverse, rasterVis, ggnewscale, Hmisc, cowplot)

#create list all sub-directories within main directory
directories <- list.dirs(opt$f, full.names = T , recursive =F)
if(!is.na(opt$a)){
  directories <- directories[!str_detect(directories, opt$a)]
}


#set image coordinates
xy <- read_delim(opt$c, delim = "\t", col_types = cols())
positions <- xy %>%
  select(-x, -y)


# stitch xray images ------------------------------------------------------

#stitch xray images into panoramas and store in raster brick 
xray_brick_list <- list()
xray_data <- list()
for(j in 1:length(directories)){
  path = directories[j]
  files <- list.files(path, full.names = T, pattern = opt$z)
  if(!is.na(opt$d)){
    files <- files[!str_detect(files, opt$d)]
  }
  if(length(files) >0){
    xray_data[[j]] <- str_extract(path, "([^/]+$)")
    message(paste0("Stitching ", str_extract(xray_data[[j]], "([^/]+$)"), " data (element ", j, " of ", length(directories), ")..."))
    xy_id <- which(positions[[1]] %in% str_extract(files, opt$u))
    panorama <- list()
    for(i in 1:length(files)){
      message(paste0("Processing image ", i, " of ", length(files), "..."))
      image <- files[i] %>% image_read() %>% 
        image_quantize(colorspace = 'gray') %>% 
        image_equalize() 
      temp_file <- tempfile()
      image_write(image, path = temp_file, format = 'tiff')
      image <- raster(temp_file) %>%
        cut(breaks = c(-Inf, 150, Inf)) - 1
      image <- aggregate(image, fact=4)
      image_extent <- extent(matrix(c(xy$x[xy_id[i]], xy$x[xy_id[i]] + 1024, xy$y[xy_id[i]], xy$y[xy_id[i]]+704), nrow = 2, ncol = 2, byrow = T))
      image_raster <- setExtent(raster(nrows = 704, ncols = 1024), image_extent, keepres = F)
      values(image_raster) <- values(image)
      panorama[[xy_id[i]]] <- image_raster
    }
      empty_xy_id <- which(!positions[[1]] %in% str_extract(files, opt$u))
      if(length(empty_xy_id) > 0){
        for(k in 1:length(empty_xy_id)){
          empty_raster_extent <- extent(matrix(c(xy$x[empty_xy_id[k]], xy$x[empty_xy_id[k]] + 1024, xy$y[empty_xy_id[k]], xy$y[empty_xy_id[k]]+704), nrow = 2, ncol = 2, byrow = T))
          empty_raster <- setExtent(raster(nrows = 704, ncols = 1024), empty_raster_extent, keepres = F)
          values(empty_raster) <- 0
          panorama[[empty_xy_id[k]]] <- empty_raster
        }
      }
      panorama_merged <- do.call(merge, panorama)
      xray_brick_list[[j]] <- panorama_merged
  }
}

message("Stitching complete. Creating x-ray brick...")
xray_brick <- do.call(brick, xray_brick_list)
names(xray_brick) <- unlist(xray_data)
message("...complete.")

#write the brick 
message("Writing brick...")


if(!is.na(opt$o)){
  dir.create(opt$o)
  if(!is.na(opt$n)){
    out_brick <- writeRaster(xray_brick, paste0(opt$o, "/", opt$n,"_brick.grd"), overwrite=TRUE, format="raster")
    x <- writeRaster(xray_brick, paste0(opt$o, "/", opt$n,"_brick.tif"), overwrite=TRUE, format="GTiff",options=c("INTERLEAVE=BAND","COMPRESS=LZW"))
  }else{
    out_brick <- writeRaster(xray_brick, path = opt$o, "brick.grd", overwrite=TRUE, format="raster")
    x <- writeRaster(xray_brick, path = opt$o, "brick.tif", overwrite=TRUE, format="GTiff",options=c("INTERLEAVE=BAND","COMPRESS=LZW"))
  }
}else{
  if(!is.na(opt$n)){
    out_brick <- writeRaster(xray_brick, paste0(opt$n,"_brick.grd"), overwrite=TRUE, format="raster")
    x <- writeRaster(xray_brick, paste0(opt$n,"_brick.tif"), overwrite=TRUE, format="GTiff",options=c("INTERLEAVE=BAND","COMPRESS=LZW"))
  }else{
    out_brick <- writeRaster(xray_brick, "brick.grd", overwrite=TRUE, format="raster")
    x <- writeRaster(xray_brick, "brick.tif", overwrite=TRUE, format="GTiff",options=c("INTERLEAVE=BAND","COMPRESS=LZW"))
  }
}


message("...complete.")

#flush everything we don't need from memory
remove(list = c("x", "xray_brick_list", "xray_data", "empty_raster", "empty_raster_extent",
                "i", "j", "k", "path", "positions", "xy_id", 
                "panorama_merged", "panorama", "empty_xy_id", "files", "directories"))


# create base SEM image ---------------------------------------------------
if(opt$p){
  
if(!is.na(opt$b)){
  SEM_images <- list.files(opt$b, full.names = T, pattern = opt$m)
}else{
  message("Please provide a file path for your SEM images to stitch. For help, see 'dataStitchR.R --help.'")
  break
}

if(!is.na(opt$y)){
  SEM_images  <- SEM_images[!str_detect(SEM_images , opt$y)]
}
SEM_panorama <- list()

message("Stitching SEM images into panorama...")
for(i in 1:length(SEM_images)){
  image <- SEM_images[i] %>% image_read() %>%
    image_quantize(colorspace = 'gray') %>%
    image_equalize()
  temp_file <- tempfile()
  image_write(image, path = temp_file, format = 'tiff')
  image <- raster(temp_file)
  image_extent <- extent(matrix(c(xy$x[i], xy$x[i] + 1024, xy$y[i], xy$y[i]+704), nrow = 2, ncol = 2, byrow = T))
  image_raster <- setExtent(raster(nrows = 704, ncols = 1024), image_extent, keepres = F)
  values(image_raster) <- values(image)
  SEM_panorama[[i]] <- image_raster
}
SEM_panorama_merged <- do.call(merge, SEM_panorama)
message("...complete.")

#flush everything we don't need from memory
remove(list = c("SEM_panorama", "SEM_images", "image", "image_extent", "image_raster"))

#optinal plot to check if SEM image merge looks correct 
#plot(SEM_panorama_merged, col = gray.colors(10, start = 0.3, end = 0.9, gamma = 2.2, alpha = NULL))


# plot the data -----------------------------------------------------------

message("Generating plot...")
# Set color palette

#palette source: https://sciencenotes.org/molecule-atom-colors-cpk-colors/

element_colors <- c("#FFFFFF", "#D9FFFF", "#CC80FF", "#C2FF00", "#FFB5B5", "#909090", "#3050F8",
                    "#FF0D0D", "#90E050", "#B3E3F5", "#AB5CF2", "#8AFF00", "#BFA6A6", "#F0C8A0",
                    "#FF8000", "#FFFF30", "#1FF01F", "#80D1E3", "#8F40D4", "#3DFF00", "#E6E6E6",
                    "#BFC2C7", "#A6A6AB", "#8A99C7", "#9C7AC7", "#E06633", "#F090A0", "#50D050",
                    "#C88033", "#7D80B0", "#C28F8F", "#668F8F", "#BD80E3", "#FFA100", "#A62929",
                    "#5CB8D1", "#702EB0", "#00FF00", "#94FFFF", "#94E0E0", "#73C2C9", "#54B5B5",
                    "#3B9E9E", "#248F8F", "#0A7D8C", "#006985", "#C0C0C0", "#FFD98F", "#A67573",
                    "#668080", "#9E63B5", "#D47A00", "#940094", "#429EB0", "#57178F", "#00C900",
                    "#70D4FF", "#FFFFC7", "#D9FFC7", "#C7FFC7", "#A3FFC7", "#8FFFC7", "#61FFC7",
                    "#45FFC7", "#30FFC7", "#1FFFC7", "#00FF9C", "#00E675", "#00D452", "#00BF38",
                    "#00AB24", "#4DC2FF", "#4DA6FF", "#2194D6", "#267DAB", "#266696", "#175487",
                    "#D0D0E0", "#FFD123", "#B8B8D0", "#A6544D", "#575961", "#9E4FB5", "#AB5C00",
                    "#754F45", "#428296", "#420066", "#007D00", "#70ABFA", "#00BAFF", "#00A1FF",
                    "#008FFF", "#0080FF", "#006BFF", "#545CF2", "#785CE3", "#8A4FE3", "#A136D4",
                    "#B31FD4", "#B31FBA", "#B30DA6", "#BD0D87", "#C70066", "#CC0059", "#D1004F",
                    "#D90045", "#E00038", "#E6002E", "#EB0026")
names(element_colors) <- c("H",  "He", "Li", "Be", "B",  "C",  "N",  "O",  "F",  "Ne", "Na", "Mg", "Al", "Si",
                           "P",  "S",  "Cl", "Ar", "K",  "Ca", "Sc", "Ti", "V",  "Cr", "Mn", "Fe", "Co", "Ni",
                           "Cu", "Zn", "Ga", "Ge", "As", "Se", "Br", "Kr", "Rb", "Sr", "Y",  "Zr", "Nb", "Mo",
                           "Tc", "Ru", "Rh", "Pd", "Ag", "Cd", "In", "Sn", "Sb", "Te", "I",  "Xe", "Cs", "Ba",
                           "La", "Ce", "Pr", "Nd", "Pm", "Sm", "Eu", "Gd", "Tb", "Dy", "Ho", "Er", "Tm", "Yb",
                           "Lu", "Hf", "Ta", "W",  "Re", "Os", "Ir", "Pt", "Au", "Hg", "Tl", "Pb", "Bi", "Po",
                           "At", "Rn", "Fr", "Ra", "Ac", "Th", "Pa", "U",  "Np", "Pu", "Am", "Cm", "Bk", "Cf",
                           "Es", "Fm", "Md", "No", "Lr", "Rf", "Db", "Sg", "Bh", "Hs", "Mt")

xray_frame <- as.data.frame(xray_brick, xy=TRUE) 
xray_frame <- gather(xray_frame, element, value, colnames(xray_frame)[3]:colnames(xray_frame)[ncol(xray_frame)])


element_plotter<-function(coord_frame, brick, SEM_image, colors){
  p <-rasterVis::gplot(SEM_image) +
    geom_tile(aes(fill = value)) +
    scale_fill_gradient(low = 'black', high = 'white') +
    ggnewscale::new_scale_fill()
  for(i in names(brick)){ 
    message(paste0("Adding ", names(brick[[i]]), " to plot..."))
    element_coords <- coord_frame %>%
      filter(element == names(brick[[i]]) & value!=0)
    p <- p+geom_raster(element_coords, mapping = aes(x, y, fill = element, alpha = value)) +
      scale_fill_manual(values = colors) +
      ggnewscale::new_scale_fill()
  }
  message("Writing plot...")
  suppressWarnings(print(p + 
                           coord_fixed() +
                           theme(axis.title = element_blank(),
                                 axis.text = element_blank(),
                                 legend.position = "none")))
}

element_plot <- element_plotter(xray_frame, xray_brick, SEM_panorama_merged, element_colors)

element_plot_legend <- data.frame(element = unique(xray_frame$element)) %>%
  rownames_to_column() %>% 
  ggplot(aes(element, rowname, fill=element)) + 
  geom_bar(stat= "identity") + 
  scale_fill_manual(values = element_colors) +
  guides(fill=guide_legend(nrow=2)) +
  theme(legend.title = ggplot2::element_blank(),
        legend.text = ggplot2::element_text(size = 8))

element_plot_with_legend <- plot_grid(
  element_plot, 
  plot_grid(get_legend(element_plot_legend), 
            ncol = 1), 
  nrow = 2, 
  rel_heights = c(8,2)
)


# generate PDF ------------------------------------------------------------

if(!is.na(opt$n)){
  if(!is.na(opt$o)){
    pdf(paste0(opt$o, "/", opt$n, "_element_plot.pdf"),
        width = 13.33, 
        height = 7.5)
  }else{
    pdf(paste0(opt$n, "_element_plot.pdf"),
        width = 13.33, 
        height = 7.5)
  }
}else{
  if(!is.na(opt$o)){
    pdf(paste0(opt$o, "/", "element_plot.pdf"),
        width = 13.33, 
        height = 7.5)
  }else{
    pdf("element_plot.pdf",
        width = 13.33, 
        height = 7.5) 
  }
}


print(element_plot_with_legend)

dev.off()

message("...complete.")

remove(list = ls())

}

网页内容由stack overflow 提供, 点击上面的
可以查看英文原文,
原文链接