在Networkx绘图中添加标题?

10

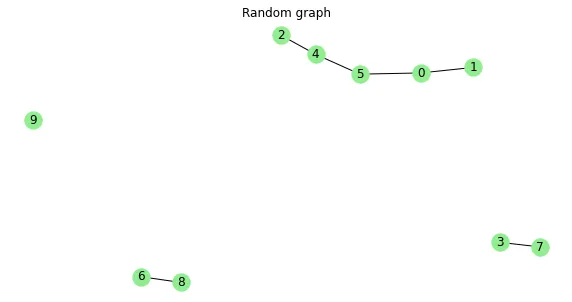
我希望我的代码创建一个带有标题的图表。使用下面的代码,图表得到了创建,但没有标题。有人能告诉我我做错了什么吗?

import pandas as pd   
import networkx as nx
from networkx.algorithms import community
import matplotlib.pyplot as plt
from datetime import datetime

...

G = nx.from_pandas_edgelist((df), 'AXIS1', 'AXIS2');
nx.draw(G,with_labels=True)

plt.title('TITLE')
plt.axis('off')
plt.savefig('test.png');
3个回答

12

也许原作者不再需要此信息,但对于未来的搜索者:如果在调用 nx.draw() 之前添加标题,则标题将显示出来,例如:

plt.figure()  
plt.title(plot_title)
nx.draw(G, node_size=20)
plt.show()

10

我只能想到某个中间步骤触发了对plt.show的调用,可能是因为共享代码导致的。尝试先设置标题,并设置一个ax,以下是示例:

plt.figure(figsize=(10,5))
ax = plt.gca()
ax.set_title('Random graph')
G = nx.fast_gnp_random_graph(10,0.2)
nx.draw(G,with_labels=True, node_color='lightgreen', ax=ax)
_ = ax.axis('off')

enter image description here


0

我的建议是定义一个只有一个节点的新图:

title=nx.Graph()
title.add_node(f'Title')
nx.draw(title, with_labels = True,  pos=nx.spring_layout(title, seed=0, center=(0, 0)), node_color='#fff')

然后将此图与所需的图一起显示,您应该使用中心参数来将此节点放置在适当的位置。这就是我如何在以下图表中添加标签 R(2),R(1) 等。

This is how I added labels R(2), R(1) , ...


网页内容由stack overflow 提供, 点击上面的
可以查看英文原文,
原文链接