如何在Python中将分割图像叠加在主图像之上
7
- user1993
5
如果您有问题的话,它非常不清楚。您说您有一张RGB图像和另一张分割图像。我们可以同时拥有两者吗?那么您最终图像中的矩形需要做什么呢?谢谢。 - Mark Setchell
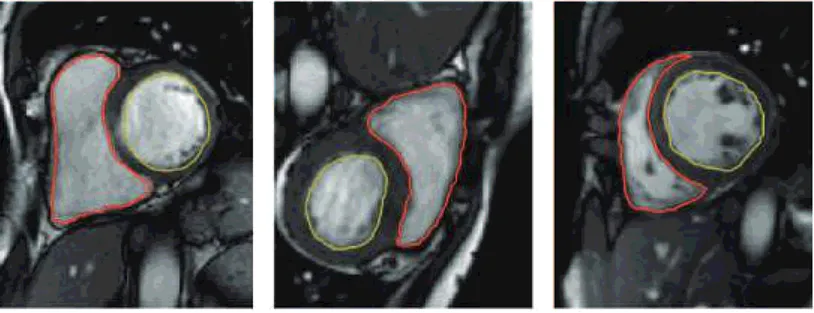
背景图像可以是任何RGB图像,这就是为什么我没有将其添加为主要图像的原因。我只需要第二个图像中矩形的计数器覆盖在背景(主)图像上,以使第一张图像中的红色和黄色线条覆盖心脏CT图像的背景图像。 - user1993
我怎样才能知道你的分割图像是什么样子?你有一条红线的SVG路径吗?你有一个透明背景,用红线勾勒出形状吗?你有一张实心图像,每个组织/对象都有一个实色吗?如果你需要帮助,让人们帮助你变得容易是一个好主意。另外,“矩形计数器”是什么意思? - Mark Setchell
我已经添加了所需的输出。感谢您的帮助。 - user1993
矩形轮廓是输出图像中的红色和黄色线条。它们应该绘制在分割图像中矩形所占据的像素上。 - user1993
3个回答
14
我尝试使用四种不同的方法:
- OpenCV
- PIL/Pillow 和 Numpy
- 使用 ImageMagick 命令行
- 来自 skimage 的形态学
方法 1 - OpenCV
- 将分割图像作为灰度图打开
- 将主图像作为灰度图打开并着色以允许注释
- 使用
cv2.findContours()查找轮廓 - 遍历轮廓并使用
cv2.drawContours()根据分割图像中的标签将每个轮廓绘制到主图像上。
文档在此处。
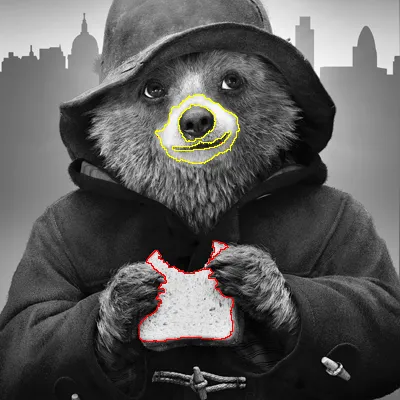
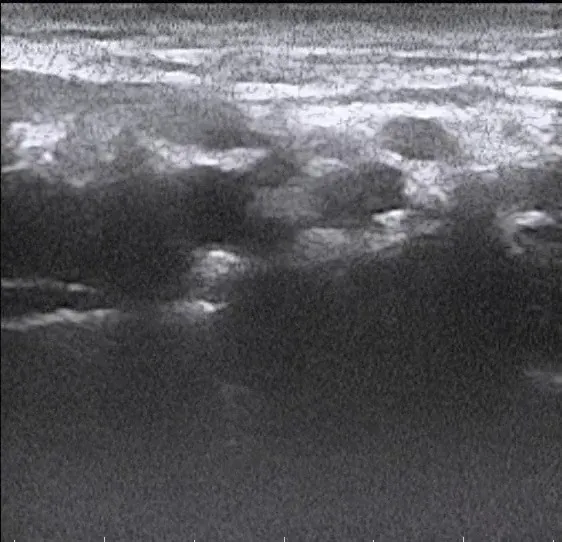
所以,从这张图片开始:

和这张分割图像:

当对比度拉伸且三明治标记为grey(1),嘴巴标记为grey(2)时,它看起来像这样:

以下是代码:
#!/usr/bin/env python3

import numpy as np
import cv2

# Load images as greyscale but make main RGB so we can annotate in colour
seg  = cv2.imread('segmented.png',cv2.IMREAD_GRAYSCALE)
main = cv2.imread('main.png',cv2.IMREAD_GRAYSCALE)
main = cv2.cvtColor(main,cv2.COLOR_GRAY2BGR)

# Dictionary giving RGB colour for label (segment label) - label 1 in red, label 2 in yellow
RGBforLabel = { 1:(0,0,255), 2:(0,255,255) }

# Find external contours
_,contours,_ = cv2.findContours(seg,cv2.RETR_EXTERNAL,cv2.CHAIN_APPROX_NONE)

# Iterate over all contours
for i,c in enumerate(contours):
    # Find mean colour inside this contour by doing a masked mean
    mask = np.zeros(seg.shape, np.uint8)
    cv2.drawContours(mask,[c],-1,255, -1)
    # DEBUG: cv2.imwrite(f"mask-{i}.png",mask)
    mean,_,_,_ = cv2.mean(seg, mask=mask)
    # DEBUG: print(f"i: {i}, mean: {mean}")

    # Get appropriate colour for this label
    label = 2 if mean > 1.0 else 1
    colour = RGBforLabel.get(label)
    # DEBUG: print(f"Colour: {colour}")

    # Outline contour in that colour on main image, line thickness=1
    cv2.drawContours(main,[c],-1,colour,1)

# Save result
cv2.imwrite('result.png',main)
结果:

方法2-使用PIL/Pillow和Numpy
- 打开分段图像并查找唯一颜色
- 打开主图像并去饱和度
- 对列表中的每种唯一颜色进行迭代处理
- ... 将所有该颜色的像素设置为白色,所有其他像素设置为黑色
- ... 找到边缘并将其用作掩膜在主图像上绘制颜色
以下是代码:
#!/usr/bin/env python3

from PIL import Image, ImageFilter
import numpy as np

def drawContour(m,s,c,RGB):
    """Draw edges of contour 'c' from segmented image 's' onto 'm' in colour 'RGB'"""
    # Fill contour "c" with white, make all else black
    thisContour = s.point(lambda p:p==c and 255)
    # DEBUG: thisContour.save(f"interim{c}.png")

    # Find edges of this contour and make into Numpy array
    thisEdges   = thisContour.filter(ImageFilter.FIND_EDGES)
    thisEdgesN  = np.array(thisEdges)

    # Paint locations of found edges in color "RGB" onto "main"
    m[np.nonzero(thisEdgesN)] = RGB
    return m

# Load segmented image as greyscale
seg = Image.open('segmented.png').convert('L')

# Load main image - desaturate and revert to RGB so we can draw on it in colour
main = Image.open('main.png').convert('L').convert('RGB')
mainN = np.array(main)

mainN = drawContour(mainN,seg,1,(255,0,0))   # draw contour 1 in red
mainN = drawContour(mainN,seg,2,(255,255,0)) # draw contour 2 in yellow

# Save result
Image.fromarray(mainN).save('result.png')
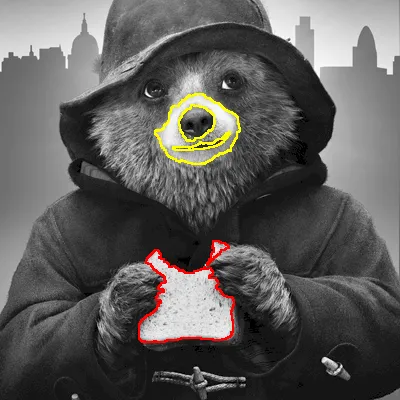
你将得到以下结果:
方法3 - ImageMagick
您也可以通过命令行完成相同的操作,而无需编写任何Python代码,只需使用安装在大多数Linux发行版上并可用于macOS和Windows的ImageMagick:
#!/bin/bash

# Make red overlay for "1" labels
convert segmented.png -colorspace gray -fill black +opaque "gray(1)" -fill white -opaque "gray(1)" -edge 1 -transparent black -fill red     -colorize 100% m1.gif
# Make yellow overlay for "2" labels
convert segmented.png -colorspace gray -fill black +opaque "gray(2)" -fill white -opaque "gray(2)" -edge 1 -transparent black -fill yellow  -colorize 100% m2.gif
# Overlay both "m1.gif" and "m2.gif" onto main image
convert main.png -colorspace gray -colorspace rgb m1.gif -composite m2.gif -composite result.png
方法 4 - 使用 skimage 进行形态学处理
这里我使用形态学处理来查找靠近 1 像素和 2 像素的黑色像素。
#!/usr/bin/env python3

import skimage.filters.rank
import skimage.morphology
import numpy as np
import cv2

# Load images as greyscale but make main RGB so we can annotate in colour
seg  = cv2.imread('segmented.png',cv2.IMREAD_GRAYSCALE)
main = cv2.imread('main.png',cv2.IMREAD_GRAYSCALE)
main = cv2.cvtColor(main,cv2.COLOR_GRAY2BGR)

# Create structuring element that defines the neighbourhood for morphology
selem = skimage.morphology.disk(1)

# Mask for edges of segment 1 and segment 2
# We are basically looking for pixels with value 1 in the segmented image within a radius of 1 pixel of a black pixel...
# ... then the same again but for pixels with a vaue of 2 in the segmented image within a radius of 1 pixel of a black pixel
seg1 = (skimage.filters.rank.minimum(seg,selem) == 0) & (skimage.filters.rank.maximum(seg, selem) == 1)
seg2 = (skimage.filters.rank.minimum(seg,selem) == 0) & (skimage.filters.rank.maximum(seg, selem) == 2)

main[seg1,:] = np.asarray([0, 0,   255]) # Make segment 1 pixels red in main image
main[seg2,:] = np.asarray([0, 255, 255]) # Make segment 2 pixels yellow in main image

# Save result
cv2.imwrite('result.png',main)
关键词: Python, PIL, Pillow, OpenCV, 分割, 分割后的, 标记, 图片, 图像处理, 边缘, 轮廓, skimage, ImageMagick, scikit-image, 形态学, 排名, 排序滤波器, 像素邻接性。
- Mark Setchell
7
这些是快速的一行代码,可以自动选择分类/类别整数值的颜色,并将叠加层应用到原始图像上。
着色整个分割区域:
from skimage import color
result_image = color.label2rgb(segmentation_results, input_image)
分割区域的彩色轮廓:
from skimage import segmentation
result_image = segmentation.mark_boundaries(input_image, segmentation_results, mode='thick')
- VoteCoffee
4
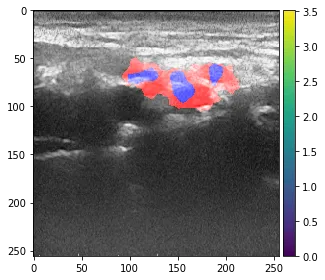
如果需要在图像上方显示半透明分割掩模,
skimage拥有内置的label2rgb()函数可以通过标签通道进行着色:
输入图像
from skimage import io, color
import matplotlib.pyplot as plt
import numpy as np

seg = np.zeros((256,256)) # create a matrix of zeroes of same size as image
seg[gt > 0.95] = 1   # Change zeroes to label "1" as per your condition(s)
seg[zz == 255] = 2

io.imshow(color.label2rgb(seg,img,colors=[(255,0,0),(0,0,255)],alpha=0.01, bg_label=0, bg_color=None))
plt.show()
- Abhi25t
3
这很好,但它将输入图像转换为灰度。如果涉及的图像是RGB,您知道任何替代方法吗? - ldavid
参数
img 接受 RGB 和灰度图像。因此它应该可以正常工作。文档也证实了这一点 - https://scikit-image.org/docs/dev/api/skimage.color.html#skimage.color.label2rgb - Abhi25t1它接受RGB图像,但在应用分割覆盖之前会转换为灰度。我希望能在覆盖后看到原始的彩色图像。编辑:我以为
saturation 参数可能是关键,但它仅存在于skimage的开发分支上,似乎无法在colab上安装。 - ldavid网页内容由stack overflow 提供, 点击上面的可以查看英文原文,
原文链接
原文链接