在Python中绘制动画箭头图

19

我正在尝试在Python中对向量(如风)进行动画处理。我尝试使用pylab中的quiver函数,并与matplotlib.animation结合使用。然而,结果显示'QuiverKey' object is not subscriptable。我想这可能是因为我没有完全理解这两个函数之间的关系,或者只是这两个函数不匹配。以下是我的代码,实际上是来自于matplotlib中的quiver和animation函数的组合。

def update_line(num, data, line):
    line.set_data(data[...,:num])
    return line,

X,Y = np.meshgrid(np.arange(0,2*np.pi,.2),np.arange(0,2*np.pi,.2) )  
U = np.cos(X)
V = np.sin(Y)

fig1 = plt.figure()
Q = quiver( X[::3, ::3], Y[::3, ::3], U[::3, ::3], V[::3, ::3],
        pivot='mid', color='r', units='inches' )
data = quiverkey(Q, 0.5, 0.03, 1, r'$1 \frac{m}{s}$', fontproperties={'weight': 'bold'})
plt.axis([-1, 7, -1, 7])
title('scales with plot width, not view')
l, = plt.plot([], [], 'r-') 
plt.xlabel('x')
plt.ylabel('y')
plt.title('test')
line_ani = animation.FuncAnimation(fig1, update_line, 25, fargs=(data, l),
interval=50, blit=True)
plt.show() 
1
好的,“data”是一个“QuiverKey”对象 - 它代表了一个箭头图的键,而不是您可以索引到的值数组。我真的不明白你的目标是什么 - 你说你想画动态箭头图,但是你的动画函数看起来像是要向一条线添加点。你能描述一下你想要实现什么吗? - ali_m
嗨ali_m,非常感谢您的评论和帮助。我的目标是创建一个动画,其中颤动物正在朝箭头方向移动。也许我对这个函数结构的理解太低了。您能帮助我理解如何使每个颤动物沿着每个箭头(向量)方向移动吗? - Isaac
1
我仍然不太理解你的意思。您是想更改箭头的长度和角度,还是要移动它们的枢轴点?据我所知,一旦创建了箭羽图,就无法更改其x、y坐标,但可以使用Q.set_UVC()来更新箭头向量。 - ali_m
谢谢ali_m。Q.set_UVC()可能对我的目标有帮助。我非常感激。我会尝试使用那个函数。 - Isaac
1个回答

34

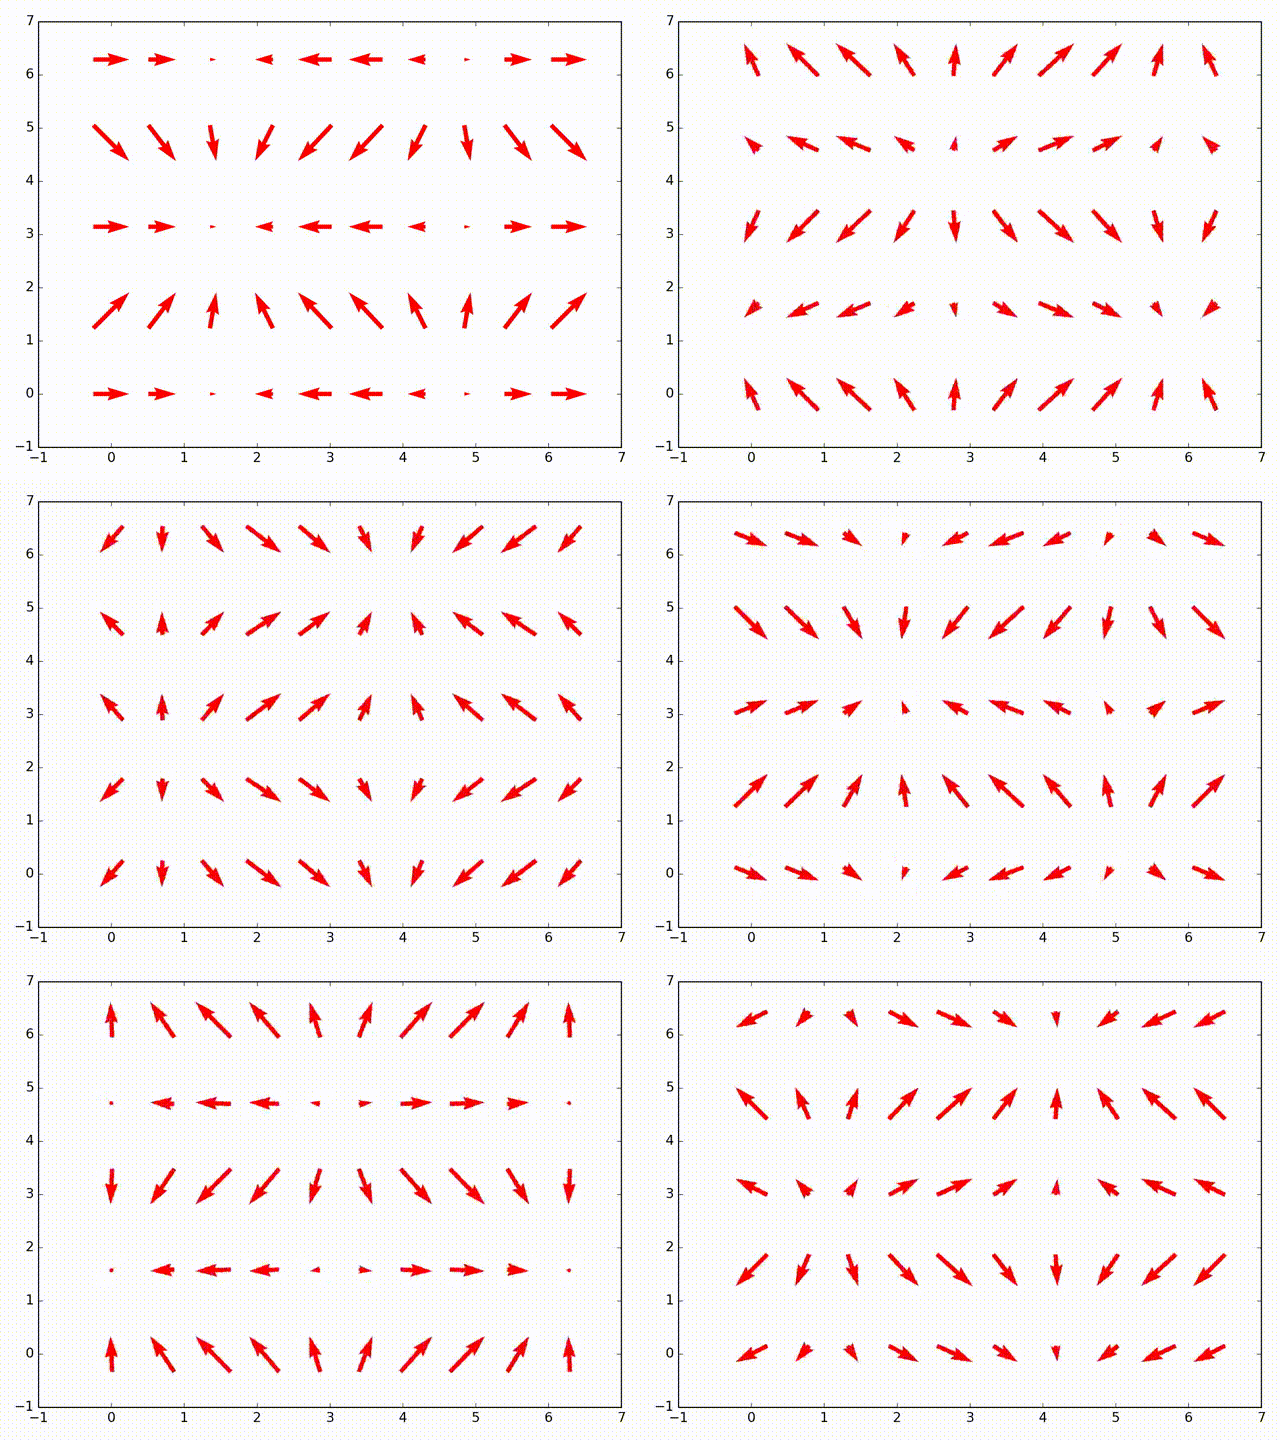
这里有一个例子可以帮助你入门:

import numpy as np
from matplotlib import pyplot as plt
from matplotlib import animation

X, Y = np.mgrid[:2*np.pi:10j,:2*np.pi:5j]
U = np.cos(X)
V = np.sin(Y)

fig, ax = plt.subplots(1,1)
Q = ax.quiver(X, Y, U, V, pivot='mid', color='r', units='inches')

ax.set_xlim(-1, 7)
ax.set_ylim(-1, 7)

def update_quiver(num, Q, X, Y):
    """updates the horizontal and vertical vector components by a
    fixed increment on each frame
    """

    U = np.cos(X + num*0.1)
    V = np.sin(Y + num*0.1)

    Q.set_UVC(U,V)

    return Q,

# you need to set blit=False, or the first set of arrows never gets
# cleared on subsequent frames
anim = animation.FuncAnimation(fig, update_quiver, fargs=(Q, X, Y),
                               interval=50, blit=False)
fig.tight_layout()
plt.show()

输入图片描述


至少在Python 3.8中,“blit=True”正常工作。 - NameOfTheRose

网页内容由stack overflow 提供, 点击上面的
可以查看英文原文,
原文链接