我有类似这样的离散数据:
height <- c(1,2,3,4,5,6,7,8)
weight <- c(100,200,300,400,500,600,700,800)
person <- c("Jack","Jim","Jill","Tess","Jack","Jim","Jill","Tess")
set <- c(1,1,1,1,2,2,2,2)
dat <- data.frame(set,person,height,weight)
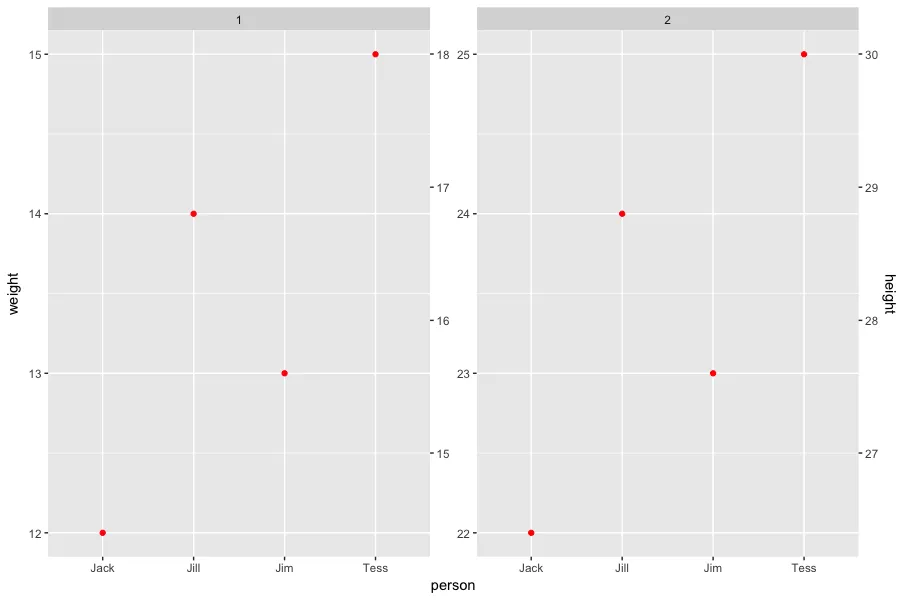
我正在尝试绘制一个具有相同x轴(人)和2个不同y轴(体重和身高)的图表。我找到的所有示例都试图绘制辅助轴(sec_axis)或使用基础图绘制离散数据。 是否有一种简单的方法在ggplot2中使用sec_axis来处理离散数据? 编辑:评论中有人建议我尝试建议的回复。但是,现在我遇到了这个错误。
这是我的当前代码:
p1 <- ggplot(data = dat, aes(x = person, y = weight)) +
  geom_point(color = "red") + facet_wrap(~set, scales="free")
p2 <- p1 + scale_y_continuous("height",sec_axis(~.*1.2, name="height"))
p2

I get the error: Error in x < range[1] :
  comparison (3) is possible only for atomic and list types
现在,我已经修改了这个示例,使其与发布的此示例相匹配。
p <- ggplot(dat, aes(x = person))
p <- p + geom_line(aes(y = height, colour = "Height"))

# adding the relative weight data, transformed to match roughly the range of the height
p <- p + geom_line(aes(y = weight/100, colour = "Weight"))

# now adding the secondary axis, following the example in the help file ?scale_y_continuous
# and, very important, reverting the above transformation
p <- p + scale_y_continuous(sec.axis = sec_axis(~.*100, name = "Relative weight [%]"))

# modifying colours and theme options
p <- p + scale_colour_manual(values = c("blue", "red"))
p <- p + labs(y = "Height [inches]",
              x = "Person",
              colour = "Parameter")
p <- p + theme(legend.position = c(0.8, 0.9))+ facet_wrap(~set, scales="free")
p
我收到一个错误,上面写着
"geom_path: Each group consists of only one observation. Do you need to
 adjust the group aesthetic?"
我得到了模板,但没有绘制任何点。
sec_axis(...)前面添加sec.axis =。如果不显式命名参数,则默认为scale_y_continuous()中的第二个参数,而breaks = sec_axis(~.*1.2, name="height")会触发错误,因为它在上下文中没有意义。 - Z.Linp1 + scale_y_continuous("height", sec_axis(sec.axis= ~.*1.2, name="height"))?这会导致错误。 - Shareggplot2不支持独立的次要轴。所有次要轴都必须基于主轴的一对一转换。 - LVG77