如何在ggplot2中制作多重条形图?

5

我在使用ggplot2时遇到了一些困难,希望能通过更多的示例学习。

我有很多数据,看起来像这个生成的东西:

data.frame(version=c('v1', 'v1', 'v1', 'v1', 'v2', 'v2', 'v2', 'v2'),
           platform=c('linux', 'linux', 'mac', 'mac',
                      'linux', 'linux', 'mac', 'mac'),
           type=c('a', 'b', 'a', 'b', 'a', 'b', 'a', 'b'),
           count=floor(runif(8, 0, 10000)))

我可以使用常规的barplot命令绘制给定操作系统类型的堆积条形图(通过使用cast切片),但是我还没有用ggplot2得到我想要的结果。
我可以通过以下方式绘制单个平台(假设上述内容保存为sample):
qplot(version, a, data=cast(sample[sample$platform=='linux',],
                            version ~ type, value="count"),
      geom='bar')

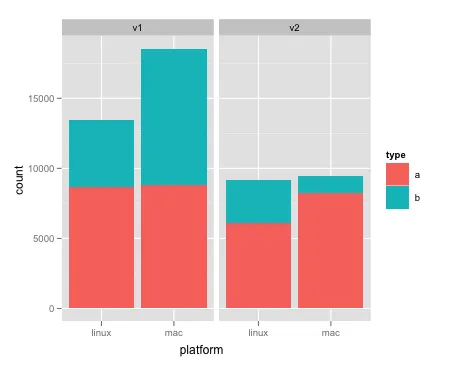
理想情况下,我希望按类型(在此示例中显式为a,仅有两种类型)堆叠,并且每个平台出现在同一图表上,按版本分组并列。

也就是说,对于每个版本,我想要三个条形图(每个平台一个),每个条形图有两个堆栈(按类型)。

1个回答

7

以下是一个选项:

dat <- data.frame(version=c('v1', 'v1', 'v1', 'v1', 'v2', 'v2', 'v2', 'v2'),
           platform=c('linux', 'linux', 'mac', 'mac',
                      'linux', 'linux', 'mac', 'mac'),
           type=c('a', 'b', 'a', 'b', 'a', 'b', 'a', 'b'),
           count=floor(runif(8, 0, 10000)))


ggplot(data = dat, aes(x = platform, y = count)) + 
    facet_wrap(~version) + 
    geom_bar(aes(fill = type))

它将产生类似于这样的东西:

输入图像描述

你的示例数据只有两个平台,所以可能那只是一个打字错误,因为你提到了三个。


抱歉,我的真实数据中有三个,但我的样本只有两个。打出所有组合很累人。:) 这看起来非常不错。我认为这可能比我要求的更容易理解。 - Dustin
2
@Dustin 没问题。这个博客有很多不错的ggplot2例子,Hadley的网站也是如此,但他的书绝对是最好的参考资料。 - joran

网页内容由stack overflow 提供, 点击上面的
可以查看英文原文,
原文链接