Matplotlib文本尺寸

47

是否可以确定matplotlib文本对象的尺寸?我如何找到它的宽度和高度(以像素为单位)?

谢谢

编辑:我认为我找到了一种方法来做到这一点。我在下面包含了一个示例。

import matplotlib as plt

f = plt.figure()
r = f.canvas.get_renderer()
t = plt.text(0.5, 0.5, 'test')

bb = t.get_window_extent(renderer=r)
width = bb.width
height = bb.height

你的意思是“t = plt.text(0.5, 0.5, 'test')”吗? - nedim
为什么不把这个作为答案加进去呢?我尝试了一下,虽然我不知道如何验证其准确性,但它返回了一致的结果。 - nedim
这可能是我见过关于Matplotlib的最省时的信息。太谢谢你了! - Dance Party2
4个回答

29
from matplotlib import pyplot as plt

f = plt.figure()
r = f.canvas.get_renderer()
t = plt.text(0.5, 0.5, 'test')

bb = t.get_window_extent(renderer=r)
width = bb.width
height = bb.height

6
bb.height是在显示坐标系中的。我该如何获取数据坐标系中的文本高度? - martinako
3
@martinako,如果您正在使用“Axes”,您可以通过以下方式获得一个转换矩阵,将显示坐标转换为数据坐标:inv = ax.transData.inverted()(其中ax是“Axes”实例)。请参见Transforms Tutorial - John Anderson
bb.width 返回的数字单位是什么?是点数吗? - j_allen_morris

12

即使在绘制完成后,我也找不到一种获取图形中文本范围的方法。

但是有一种方法可以仅呈现文本并从中获取各种几何信息:

t = matplotlib.textpath.TextPath((0,0), 'hello', size=9, prop='WingDings')
bb = t.get_extents()

#bb:
#Bbox(array([[  0.759375 ,   0.8915625],
#            [ 30.4425   ,   5.6109375]]))

w = bb.width   #29.683125
h = bb.height  #4.7193749

编辑

我已经试用了一段时间,但是我遇到了一个无法解决的不一致性问题。也许有人可以帮忙。似乎比例有些偏差,我不知道是dpi问题还是bug问题,但这个示例可以很好地说明:

import matplotlib
from matplotlib import pyplot as plt
plt.cla()

p = plt.plot([0,10],[0,10])

#ffam = 'comic sans ms'
#ffam = 'times new roman'
ffam = 'impact'
fp = matplotlib.font_manager.FontProperties(
    family=ffam, style='normal', size=30,
    weight='normal', stretch='normal')

txt = 'The quick brown fox'
plt.text(100, 100, txt, fontproperties=fp, transform=None)

pth = matplotlib.textpath.TextPath((100,100), txt, prop=fp)
bb = pth.get_extents()

# why do I need the /0.9 here??
rec = matplotlib.patches.Rectangle(
    (bb.x0, bb.y0), bb.width/0.9, bb.height/0.9, transform=None)
plt.gca().add_artist(rec)

plt.show()

1
我似乎没有textpath模块。这是你必须添加到matplotlib中的内容吗? - David
@David。你使用的matplotlib版本是什么?当你运行from matplotlib import textpath时,你得到了什么错误? - Paul
我正在使用版本0.99.1.1。我收到的错误是ImportError: cannot import name textpath - David
@David:我正在使用1.0.1版本,也许是时候升级了。 - Paul
这个方法还存在问题吗? - AnnanFay
显示剩余2条评论

8

以下是对已经接受答案的简单修改;

如果您想以轴坐标获取宽度和高度,可以使用以下方法:

from matplotlib import pyplot as plt

fig, ax = plt.subplots()
r = fig.canvas.get_renderer()
t = ax.text(0.5, 0.5, 'test')

bb = t.get_window_extent(renderer=r).inverse_transformed(ax.transData)
width = bb.width
height = bb.height

4
"inverse_transformed" 已经被废弃,请使用以下语句替代: bb = t.get_window_extent(renderer=r).transformed(plt.gca().transData.inverted()) - mbrennwa
2
@mbrennwa 你可以直接使用 ax 而不是 plt.gca() - Guimoute

7

谢谢讨论。我可以把答案放在一个函数里,自动调整文本对象的字体大小,根据给定的数据坐标中的宽度和高度(我认为这通常很有用,想在这里分享一下)。
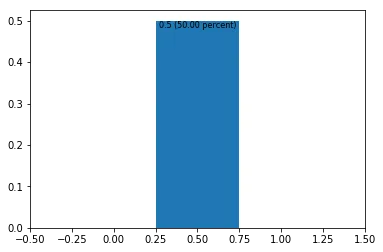
重叠于条形图边缘的文本示例:

import matplotlib.pyplot as plt

fig, ax = plt.subplots()
ax.bar(0.5, 0.5, width=0.5)
text = ax.text(0.5, 0.5, 
                "0.5 (50.00 percent)", 
                va='top', ha='center', 
                fontsize=12)
ax.set_xlim(-0.5, 1.5)

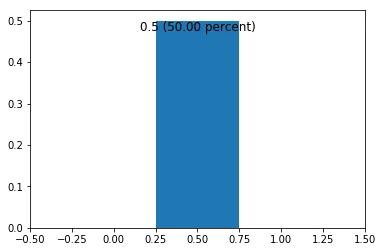
相反,自动适应文本对象的字体大小到条形图的宽度:

在此输入图片描述

import matplotlib.pyplot as plt
from matplotlib.transforms import Bbox

def auto_fit_fontsize(text, width, height, fig=None, ax=None):
    '''Auto-decrease the fontsize of a text object.

    Args:
        text (matplotlib.text.Text)
        width (float): allowed width in data coordinates
        height (float): allowed height in data coordinates
    '''
    fig = fig or plt.gcf()
    ax = ax or plt.gca()

    # get text bounding box in figure coordinates
    renderer = fig.canvas.get_renderer()
    bbox_text = text.get_window_extent(renderer=renderer)

    # transform bounding box to data coordinates
    bbox_text = Bbox(ax.transData.inverted().transform(bbox_text))

    # evaluate fit and recursively decrease fontsize until text fits
    fits_width = bbox_text.width < width if width else True
    fits_height = bbox_text.height < height if height else True
    if not all((fits_width, fits_height)):
        text.set_fontsize(text.get_fontsize()-1)
        auto_fit_fontsize(text, width, height, fig, ax)

fig, ax = plt.subplots()
ax.bar(0.5, 0.5, width=0.5)
text = ax.text(0.5, 0.5, 
                "0.5 (50.00 percent)", 
                va='top', ha='center', 
                fontsize=12)
ax.set_xlim(-0.5, 1.5)
auto_fit_fontsize(text, 0.5, None, fig=fig, ax=ax)

enter image description here


网页内容由stack overflow 提供, 点击上面的
可以查看英文原文,
原文链接