我有一个大型的2D数据集,想要为每个X,Y对关联一个颜色,并使用matplotlib绘制它。这里涉及到1000000个点。我想知道在性能(速度)方面最好的方法是什么,您是否可以提供一些示例。
1个回答
9
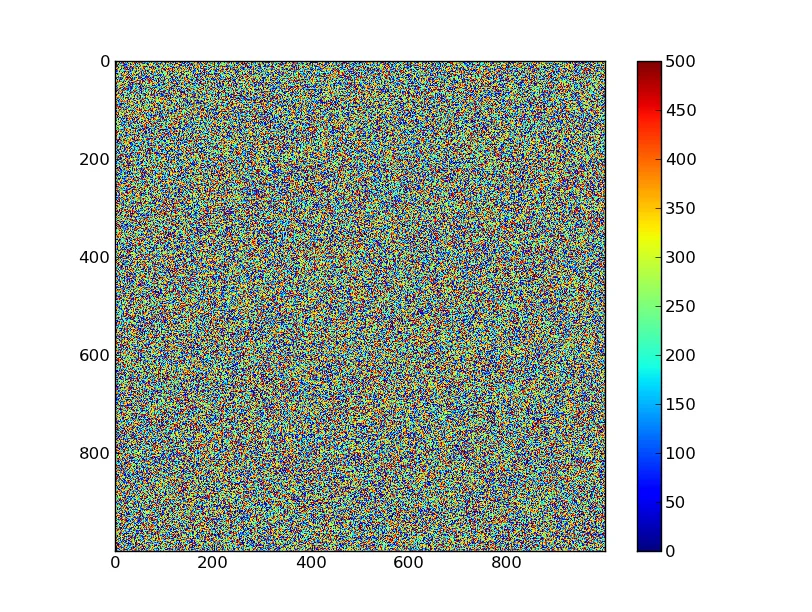
如果您正在处理常规网格,请将其视为图像:
import numpy as np
import matplotlib.pyplot as plt

nrows, ncols = 1000, 1000
z = 500 * np.random.random(nrows * ncols).reshape((nrows, ncols))

plt.imshow(z, interpolation='nearest')
plt.colorbar()
plt.show()
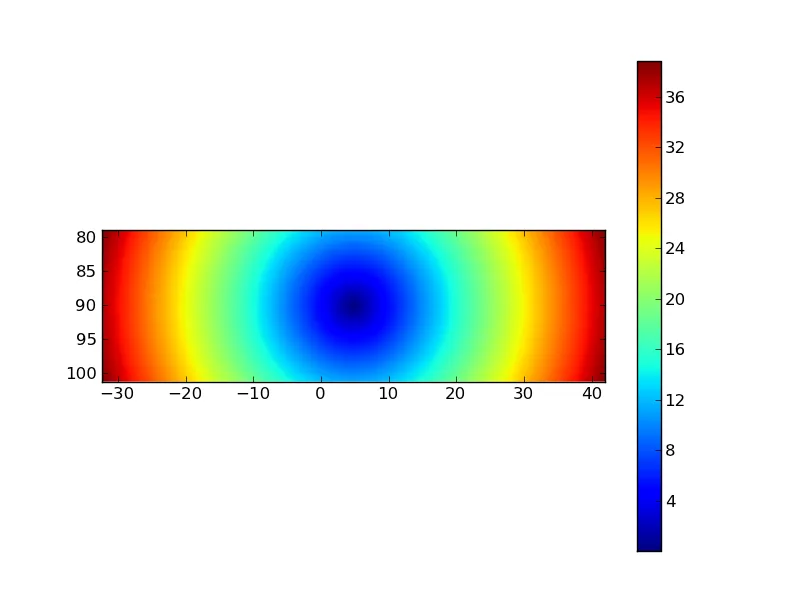
如果你有组成规则网格的随机排序的x、y、z三元组,那么你需要将它们进行网格化。
基本上,你可能会有像这样的一些东西:
import numpy as np
import matplotlib.pyplot as plt

# Generate some data
nrows, ncols = 1000, 1000
xmin, xmax = -32.4, 42.0
ymin, ymax = 78.9, 101.3

dx = (xmax - xmin) / (ncols - 1)
dy = (ymax - ymin) / (ncols - 1)

x = np.linspace(xmin, xmax, ncols)
y = np.linspace(ymin, ymax, nrows)
x, y = np.meshgrid(x, y)

z = np.hypot(x - x.mean(), y - y.mean())
x, y, z = [item.flatten() for item in (x,y,z)]

# Scramble the order of the points so that we can't just simply reshape z
indicies = np.arange(x.size)
np.random.shuffle(indicies)
x, y, z = [item[indicies] for item in (x, y, z)]

# Up until now we've just been generating data...
# Now, x, y, and z probably represent something like you have.

# We need to make a regular grid out of our shuffled x, y, z indicies.
# To do this, we have to know the cellsize (dx & dy) that the grid is on and
# the number of rows and columns in the grid.

# First we convert our x and y positions to indicies...
idx = np.round((x - x.min()) / dx).astype(np.int)
idy = np.round((y - y.min()) / dy).astype(np.int)

# Then we make an empty 2D grid...
grid = np.zeros((nrows, ncols), dtype=np.float)

# Then we fill the grid with our values:
grid[idy, idx] = z

# And now we plot it:
plt.imshow(grid, interpolation='nearest',
        extent=(x.min(), x.max(), y.max(), y.min()))
plt.colorbar()
plt.show()
- Joe Kington
网页内容由stack overflow 提供, 点击上面的可以查看英文原文,
原文链接
原文链接
imshow吗?http://matplotlib.sourceforge.net/api/pyplot_api.html#matplotlib.pyplot.imshow 你想要如何指定X,Y对的颜色?你想为每1e6个位置指定一个独特的颜色吗?(这是不可能在视觉上区分1e6种颜色的...)你想将值映射到一个颜色条中吗?(这是imshow默认执行的操作) - Joe Kington