使用R有效地排序随机生成的横截面

7
问题

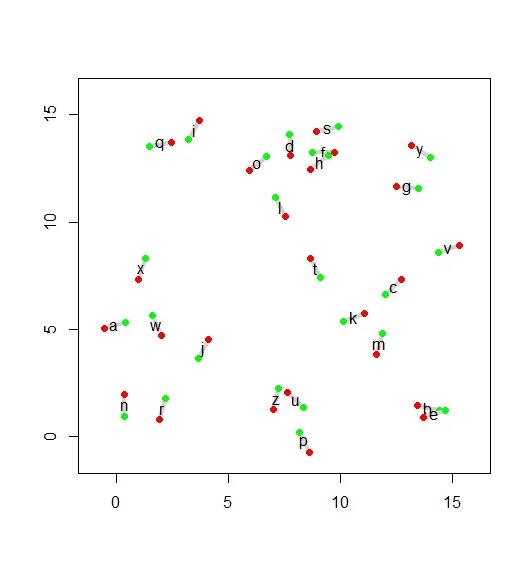
我正在寻找一种方法来有效地对固定目标周围随机选择的采样横断面进行排序。这些横断面生成后,需要按空间意义上有意义的方式进行排序,从而使行进路线距离最小化。这可以通过确保当前横断面的终点尽可能靠近下一个横断面的起点来实现。此外,不能重复使用任何横断面。

因为有数千个横断面需要排序,而手动完成这个任务非常繁琐,所以我正在尝试使用R自动化这个过程。我已经生成了横断面,每个横断面都有一个起点和终点,其位置使用360度系统表示(例如,0是北,90是东,180是南,270是西)。我还生成了一些代码,似乎指示了下一个横断面的起点和ID,但是这段代码存在一些问题:(1)它可能会在考虑起点和终点时产生错误,(2)它无法实现我最终需要的结果,(3)代码本身似乎过于复杂,我不得不想知道是否有更简单的方法来完成这个任务。

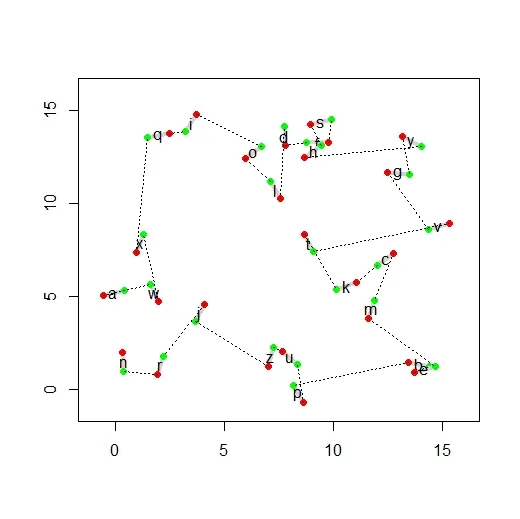
理想情况下,代码应该将横断面重新排序,使其与应飞行的顺序相匹配,而不是最初输入的顺序。

数据

为了简单起见,假设有10条需要排序的横断面。

# Transect ID for the start point
StID <- c(seq(1, 10, 1))

# Location of transect start point, based on a 360-degree circle
StPt <- c(342.1, 189.3, 116.5, 67.9, 72, 208.4, 173.2, 97.8, 168.7, 138.2)

# Transect ID for the end point
EndID <- c(seq(1, 10, 1))

# Location of transect start point, based on a 360-degree circle
EndPt <- c(122.3, 313.9, 198.7, 160.4, 166, 26.7, 312.7, 273.7, 288.8, 287.5)

# Dataframe
df <- cbind.data.frame(StPt, StID, EndPt, EndID)

我尝试过的方法

请随意忽略这段代码,因为必须有更好的方法,而且它并没有真正实现预期的结果。目前,我正在使用一个嵌套的for循环,非常难以直观地跟踪,但这是迄今为止我最好的尝试。

# Create two new columns that will be populated using a loop
df$StPt_Next <- NA
df$ID_Next <- NA

# Also create a list to be populated as end and start points are matched
used <- c(df$StPt[1]) #puts the start point of transect #1 into the used vector since we will start with 1 and do not want to have it used again

# Then, for every row in the dataframe...
for (i in seq(1,length(df$EndPt)-1, 1)){ # Selects all rows except the last one as the last transect should have no "next" transect
  # generate some print statements to indicate that the script is indeed running while you wait....
  print(paste("######## ENDPOINT", i, ":", df$EndPt[i], " ########"))
  print(paste("searching for a start point that fits criteria to follow this endpoint",sep=""))
  # sequentially select each end point
  valueEndPt <- df[i,1]
  # and order the index by taking the absolute difference of end and start points and, if this value is greater than 180, also subtract from 360 so all differences are less than 180, then order differences from smallest to largest  
  orderx <- order(ifelse(360-abs(df$StPt-valueEndPt) > 180, 
                         abs(df$StPt-valueEndPt),
                         360-abs(df$StPt-valueEndPt)))
  tmp <- as.data.frame(orderx)
  # specify index value
  index=1
  # for as long as there is an "NA" present in the StPt_Next created before for loop...  
  while (is.na(df$StPt_Next[i])) {
    #select the value of the ordered index in sequential order     
    j=orderx[index]
    # if the start point associated with a given index is present in the list of used values...
    if (df$StPt[j] %in% used){
      # then have R print a statement indicate this is the case...
      print(paste("passing ",df$StPt[j], " as it has already been used",sep=""))
      # and move onto the next index
      index=index+1
      # break statement intended to skip the remainder of the code for values that have already been used      
      next
      # if the start point associated with a given index is not present in the list of used values...      
    } else {
      # then identify the start point value associated with that index ID... 
      valueStPt <- df$StPt[j]
      # and have R print a statement indicating an attempt is being made to use the next value      
      print(paste("trying ",df$StPt[j],sep=""))
      # if the end transect number is different from the start end transect number...
      if (df$EndID[i] != df$StID[j]) { 
        # then put the start point in the new column...
        df$StPt_Next[i] <- df$StPt[j]
        # note which record this start point came from for ease of reference/troubleshooting...
        df$ID_Next[i] <- j
        # have R print a statement that indicates a value for the new column has beed selected...        
        print(paste("using ",df$StPt[j],sep=""))
        # and add that start point to the list of used ones
        used <- c(used,df$StPt[j])
        # otherwise, if the end transect number matches the start end transect number...
      } else {
        # keep NA in this column and try again
        df$StPt_Next[i] <- NA
        # and indicate that this particular matched pair can not be used
        print(paste("cant use ",valueStPt," as the column EndID (related to index in EndPt) and StID (related to index in StPt) values are matching",sep=""))
      }# end if else statement to ensure that start and end points come from different transects
      # and move onto the next index
      index=index+1
    }# end if else statement to determine if a given start point still needs to be used
  }# end while loop to identify if there are still NA's in the new column
}# end for loop

输出结果

当代码没有产生明确的错误时,比如提供的示例数据,输出结果如下:

    StPt StID EndPt EndID StPt_Next ID_Next
1  342.1    1 122.3     1      67.9       4
2  189.3    2 313.9     2     173.2       7
3  116.5    3 198.7     3      97.8       8
4   67.9    4 160.4     4      72.0       5
5   72.0    5 166.0     5     116.5       3
6  208.4    6  26.7     6     189.3       2
7  173.2    7 312.7     7     168.7       9
8   97.8    8 273.7     8     138.2      10
9  168.7    9 288.8     9     208.4       6
10 138.2   10 287.5    10        NA      NA

最后两列是代码生成并添加到原始数据框中的。StPt_Next有下一个最近起点的位置,ID_Next表示与该下一个起点位置相关联的横断面ID。ID_Next列表明应按以下顺序飞行横断面:1、4、5、3、8、10、NA(即结束),2、7、9、6形成自己的循环回到2。
有两个具体问题我解决不了:
(1)存在形成一条连续序列的问题。我认为这与1成为起始横断面,10成为最后一横断面有关,但不知道如何在代码中指示倒数第二个横断面必须与10匹配,以便序列包括所有10个横断面,然后以表示最终结束点的"NA"终止。
(2)为了真正自动化这个过程,在修复由于过早引入"NA"作为ID_next导致序列提前终止之后,将创建一个新列,允许根据最有效的进展重新排序横断面,而不是基于它们的EndID/StartID的原始顺序。
预期结果
如果我们假装我们只有6个要排序的横断面,并忽略由于过早引入"NA"而无法排序的4个横断面,那么预期的结果如下:
    StPt StID EndPt EndID StPt_Next ID_Next TransNum
1  342.1    1 122.3     1      67.9       4        1
4   67.9    4 160.4     4      72.0       5        2
5   72.0    5 166.0     5     116.5       3        3
3  116.5    3 198.7     3      97.8       8        4
8   97.8    8 273.7     8     138.2      10        5
10 138.2   10 287.5    10        NA      NA        6

编辑:关于代码明确生成的错误信息的说明

如前所述,该代码存在一些缺陷。另一个缺陷是,在尝试排序更多的横断面时,它经常会产生错误。我不确定在过程的哪个步骤中生成了错误,但我猜测这可能与无法匹配最后几个横断面有关,可能是由于没有达到“orderx”设定的标准。打印语句显示“trying NA”而不是数据库中的起点,导致出现此错误:“if (df$EndID[i]!= df$StID[j]) { :missing value where TRUE/FALSE needed”。我推测需要另一个if-else语句,以某种方式指示“如果余下的点不符合orderx的条件,则强制将它们与剩余的任何横断面相匹配,以便为所有内容分配StPt_Next和ID_Next”。
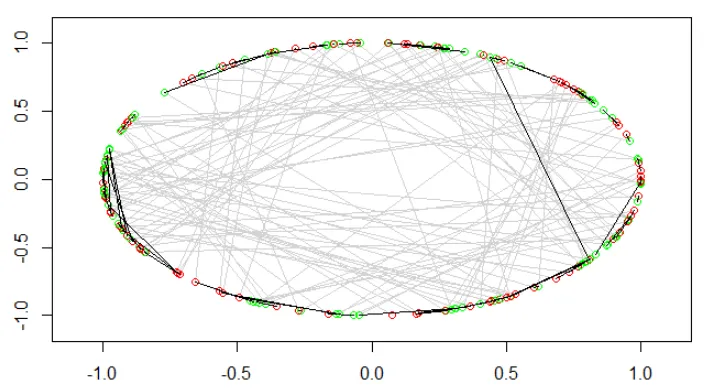
这里是一个更大的数据集,将生成错误:

EndPt <- c(158.7,245.1,187.1,298.2,346.8,317.2,74.5,274.2,153.4,246.7,193.6,302.3,6.8,359.1,235.4,134.5,111.2,240.5,359.2,121.3,224.5,212.6,155.1,353.1,181.7,334,249.3,43.9,38.5,75.7,344.3,45.1,285.7,155.5,183.8,60.6,301,132.1,75.9,112,342.1,302.1,288.1,47.4,331.3,3.4,185.3,62,323.7,188,313.1,171.6,187.6,291.4,19.2,210.3,93.3,24.8,83.1,193.8,112.7,204.3,223.3,210.7,201.2,41.3,79.7,175.4,260.7,279.5,82.4,200.2,254.2,228.9,1.4,299.9,102.7,123.7,172.9,23.2,207.3,320.1,344.6,39.9,223.8,106.6,156.6,45.7,236.3,98.1,337.2,296.1,194,307.1,86.6,65.5,86.6,296.4,94.7,279.9)

StPt <- c(56.3,158.1,82.4,185.5,243.9,195.6,335,167,39.4,151.7,99.8,177.2,246.8,266.1,118.2,358.6,357.9,99.6,209.9,342.8,106.5,86.4,35.7,200.6,65.6,212.5,159.1,297,285.9,300.9,177,245.2,153.1,8.1,76.5,322.4,190.8,35.2,342.6,8.8,244.6,202,176.2,308.3,184.2,267.2,26.6,293.8,167.3,30.5,176,74.3,96.9,186.7,288.2,62.6,331.4,254.7,324.1,73.4,16.4,64,110.9,74.4,69.8,298.8,336.6,58.8,170.1,173.2,330.8,92.6,129.2,124.7,262.3,140.4,321.2,34,79.5,263,66.4,172.8,205.5,288,98.5,335.2,38.7,289.7,112.7,350.7,243.2,185.4,63.9,170.3,326.3,322.9,320.6,199.2,287.1,158.1)

EndID <- c(seq(1, 100, 1))

StID <- c(seq(1, 100, 1))

df <- cbind.data.frame(StPt, StID, EndPt, EndID)

非常感谢任何建议!


1
听起来像是旅行商问题。 - chinsoon12
@chinsoon12 谢谢!我同意我的问题和旅行商问题之间可能存在一些相似之处,我会研究这个主题以寻找潜在的解决方案。 - Wu Wei
当你的代码出现问题时,你会得到什么错误信息?在哪个阶段出现的问题? - Limey
@Limey 很好的问题!我编辑了原帖,包括错误描述和会生成错误的数据。谢谢! - Wu Wei
3个回答

4
正如 @chinsoon12 在你的问题中指出的那样,你面临着一个(非对称的)旅行商问题。不对称性是由于你的 transecs 的起点和终点不同造成的。
ATSP 是一个著名的 NP 完全问题。因此,即使对于中等规模的问题,精确解决方案也非常困难(有关更多信息,请参见wikipedia)。因此,在大多数情况下,我们能做的最好的就是近似或启发式算法。正如你所提到的,有数千个 transects,这至少是一个中等规模的问题。
与其从头开始编写 ATSP 近似算法,不如使用现有的 R TSP 库。其中包括几个近似算法。参考文档在 here
以下是我使用 TSP 包应用于你的问题的过程。从设置开始(假设我已经像你的问题中一样运行了 StPtStIDEndPtEndID)。
install.packages("TSP")
library(TSP)
library(dplyr)

# Dataframe
df <- cbind.data.frame(StPt, StID, EndPt, EndID)
# filter to 6 example nodes for requested comparison
df = df %>% filter(StID %in% c(1,3,4,5,8,10))

我们将使用距离矩阵来进行ATSP。矩阵中的位置[row,col]表示从横截面row的(结束点)到横截面col的(起始点)的费用/距离。此代码创建整个距离矩阵。
# distance calculation
transec_distance = function(end,start){
  abs_dist = abs(start-end)
  ifelse(360-abs_dist > 180, abs_dist, 360-abs_dist)
}

# distance matrix
matrix_distance = matrix(data = NA, nrow = nrow(df), ncol = nrow(df))

for(start_id in 1:nrow(df)){
  start_point = df[start_id,'StPt']

  for(end_id in 1:nrow(df)){
    end_point = df[end_id,'EndPt']
    matrix_distance[end_id,start_id] = transec_distance(end_point, start_point)
  }
}

请注意,有更有效的方法来构建距离矩阵。然而,我选择了这种方法是因为它更加清晰易懂。根据您的计算机和具体的横断面数量,此代码可能运行非常缓慢。
另外,请注意,该矩阵的大小与横断面数量的平方成正比。因此,对于大量的横断面,您会发现内存不足。
解决过程非常无聊。距离矩阵被转换为ATSP对象,并将ATSP对象传递给求解器。然后,我们继续向原始df添加排序/旅行信息。
answer = solve_TSP(as.ATSP(matrix_distance))
# get length of cycle
print(answer)

# sort df to same order as solution
df_w_answer = df[as.numeric(answer),]
# add info about next transect to each transect
df_w_answer = df_w_answer %>%
  mutate(visit_order = 1:nrow(df_w_answer)) %>%
  mutate(next_StID = lead(StID, order_by = visit_order),
         next_StPt = lead(StPt, order_by = visit_order))
# add info about next transect to each transect (for final transect)
df_w_answer[df_w_answer$visit_order == nrow(df_w_answer),'next_StID'] =
  df_w_answer[df_w_answer$visit_order == 1,'StID']
df_w_answer[df_w_answer$visit_order == nrow(df_w_answer),'next_StPt'] =
  df_w_answer[df_w_answer$visit_order == 1,'StPt']
# compute distance between end of each transect and start of next
df_w_answer = df_w_answer %>% mutate(dist_between = transec_distance(EndPt, next_StPt))

在这一点上,我们有一个循环。您可以选择任何节点作为起点,按照df中给出的顺序从EndIDnext_StID,然后您将覆盖最小距离(良好近似)中的每个横断面。
但是,在您的“预期结果”中,您有一个路径解决方案(例如,从横断面1开始,完成于横断面10)。我们可以通过排除单个最昂贵的转换将循环变成路径:
# as path (without returning to start)
min_distance = sum(df_w_answer$dist_between) - max(df_w_answer$dist_between)
path_start = df_w_answer[df_w_answer$dist_between == max(df_w_answer$dist_between), 'next_StID']
path_end = df_w_answer[df_w_answer$dist_between == max(df_w_answer$dist_between), 'EndID']

print(sprintf("minimum cost path = %.2f, starting at node %d, ending at node %d",
              min_distance, path_start, path_end))

运行以上代码会得到一个与您想要的结果不同但更好的答案。我得到以下顺序:1 --> 5 --> 8 --> 4 --> 3 --> 10 --> 1
  • 从样线1到样线10的路径总长度为428,如果我们还从样线10返回到样线1,使其成为一个循环,则总长度将为483。
  • 使用R中的TSP包,我们可以得到从1到10的路径,总距离为377,作为一个循环则为431。
  • 如果我们从节点4开始并以节点8结束,则总距离为277。

一些额外的节点:

  • 并非所有的TSP求解器都是确定性的,因此如果您再次运行或按不同顺序运行输入行,则可能会得到一些答案上的变化。
  • TSP问题比您描述的横断面问题要更加通用。可能您的问题有足够的附加/特殊特征,使其可以在合理的时间内完美解决。但这将把您的问题移入数学领域。
  • 如果您的内存不足以创建距离矩阵,请查看TSP软件包的文档。它包含几个示例,这些示例使用地理坐标作为输入,而不是距离矩阵。这是一个更小的输入大小(假设该软件包在运行时计算距离),因此如果您将起点和终点转换为坐标并指定欧几里得(或其他常见的距离函数),则可以避免某些计算机内存限制。

1
我认为你的距离计算是正确的。 - Gorka
这太棒了,谢谢!希望有一天我也能回报您。此外,您清晰、简洁、详尽的解释真正补充了原始帖子和代码。我能够添加几行额外的代码来重新分配visit_order到起点和终点,以遵循最小成本路径(例如,从节点4开始,以节点8结束)。再次感谢@Simon! - Wu Wei
另外,针对生成距离矩阵可能需要的时间的警告,我使用的是2016年惠普Pavillion笔记本电脑,在处理100个横切线的数据时只需2.86秒。这可能对其他考虑使用此解决方案尝试实现类似功能的人有所帮助! - Wu Wei

1
另一种使用TSP包的方法...
以下是设置。
library(TSP)

planeDim = 15
nTransects = 26

# generate some random transect beginning points in a plane, the size of which
# is defined by planeDim
b = cbind(runif(nTransects)*planeDim, runif(nTransects)*planeDim)
# generate some random transect ending points that are a distance of 1 from each
# beginning point
e = t(
  apply(
    b, 
    1, 
    function(x) {
      bearing = runif(1)*2*pi
      x + c(cos(bearing), sin(bearing))
    }
  )
)

为了好玩,我们可以将横断面可视化:

# make an empty graph space
plot(1,1, xlim = c(-1, planeDim + 1), ylim = c(-1, planeDim + 1), ty = "n")

# plot the beginning of each transect as a green point, the end as a red point,
# with a thick grey line representing the transect
for(i in 1:nrow(e)) {
  xs = c(b[i,1], e[i,1])
  ys = c(b[i,2], e[i,2])
  lines(xs, ys, col = "light grey", lwd = 4)
  points(xs, ys, col = c("green", "red"), pch = 20, cex = 1.5)
  text(mean(xs), mean(ys), letters[i])
}

Random transects 'a' through 'z'

所以,给定一个由x,y对组成的起始点矩阵(“b”),以及一个由x,y对组成的每条样线的终点矩阵(“e”),解决方案是...
# a function that calculates the distance from all endpoints in the ePts matrix
# to the single beginning point in bPt
dist = function(ePts, bPt) {
  # apply pythagorean theorem to calculate the distance between every end point
  # in the matrix ePts to the point bPt
  apply(ePts, 1, function(p) sum((p - bPt)^2)^0.5)
}

# apply the "dist" function to all begining points to create the distance
# matrix. since the distance from the end of transect "foo" to the beginning of
# "bar" is not the same as from the end of "bar" to the beginning of "foo," we
# have an asymmetric travelling sales person problem.  Therefore, distance
# matrix is directional.  The distances at any position in the matrix must be
# the distance from the transect shown in the row label and to the transect
# shown in the column label.
distMatrix = apply(b, 1, FUN = dist, ePts = e)
# for covenience, we'll labels the trasects a to z
dimnames(distMatrix) = list(letters, letters)

# set the distance between the beginning and end of each transect to zero so
# that there is no "cost" to walking the transect
diag(distMatrix) = 0

这是距离矩阵的左上角:
> distMatrix[1:6, 1:6]
         a          b         c         d         e          f
a  0.00000 15.4287270 12.637979 12.269356 15.666710 12.3919715
b 13.58821  0.0000000  5.356411 13.840444  1.238677 12.6512352
c 12.48161  6.3086852  0.000000  8.427033  6.382304  7.1387840
d 10.69748 13.5936114  7.708183  0.000000 13.718517  0.9836146
e 14.00920  0.7736654  5.980220 14.470826  0.000000 13.2809601
f 12.24503 12.8987043  6.984763  2.182829 12.993283  0.0000000

现在,TSP包中的三行代码即可解决问题。
atsp = as.ATSP(distMatrix)
tour = solve_TSP(atsp)
# assume we want to start our circuit at transect "a".
path = cut_tour(tour, "a", exclude_cut = F)

变量 path 显示了您应该访问样线的顺序:
> path
 a  w  x  q  i  o  l  d  f  s  h  y  g  v  t  k  c  m  e  b  p  u  z  j  r  n 
 1 23 24 17  9 15 12  4  6 19  8 25  7 22 20 11  3 13  5  2 16 21 26 10 18 14 

我们可以将路径添加到可视化中:
for(i in 1:(length(path)-1)) {
  lines(c(e[path[i],1], b[path[i+1],1]), c(e[path[i],2], b[path[i+1], 2]), lty = "dotted")
}

Transects with connecting paths


1
很好的可重复示例,将横断面可视化是一个不错的想法!字母也很酷,但似乎存在限制,只能分配26个事件的字母。除此之外,我已经成功利用我的数据通过将基于360度的起点和终点转换为x、y坐标来生成路径,并且其结果看起来和我预期的一样。谢谢! - Wu Wei

1
感谢大家的建议,@Simon的解决方案最符合我的问题。@Geoffrey使用x,y坐标的实际方法非常好,因为它允许绘制横断面和旅行顺序。因此,我发布了一个混合解决方案,它是由他们两个人的代码以及额外的注释和代码生成的,以详细说明过程并达到我所追求的实际结果。我不确定这是否会帮助将来的任何人,但由于没有提供100%解决我的问题的答案,我想分享我想出的解决方案。

正如其他人所指出的那样,这是一种旅行推销员问题。它是不对称的,因为从横断面“t”的末端到横断面“t+1”的开头的距离与从横断面“t+1”的末端到横断面“t”的开始的距离不同。此外,它是一种“路径”解决方案,而不是“循环”解决方案。

#=========================================
# Packages
#=========================================
library(TSP)
library(useful)
library(dplyr)

#=========================================
# Full dataset for testing
#=========================================
EndPt <- c(158.7,245.1,187.1,298.2,346.8,317.2,74.5,274.2,153.4,246.7,193.6,302.3,6.8,359.1,235.4,134.5,111.2,240.5,359.2,121.3,224.5,212.6,155.1,353.1,181.7,334,249.3,43.9,38.5,75.7,344.3,45.1,285.7,155.5,183.8,60.6,301,132.1,75.9,112,342.1,302.1,288.1,47.4,331.3,3.4,185.3,62,323.7,188,313.1,171.6,187.6,291.4,19.2,210.3,93.3,24.8,83.1,193.8,112.7,204.3,223.3,210.7,201.2,41.3,79.7,175.4,260.7,279.5,82.4,200.2,254.2,228.9,1.4,299.9,102.7,123.7,172.9,23.2,207.3,320.1,344.6,39.9,223.8,106.6,156.6,45.7,236.3,98.1,337.2,296.1,194,307.1,86.6,65.5,86.6,296.4,94.7,279.9)

StPt <- c(56.3,158.1,82.4,185.5,243.9,195.6,335,167,39.4,151.7,99.8,177.2,246.8,266.1,118.2,358.6,357.9,99.6,209.9,342.8,106.5,86.4,35.7,200.6,65.6,212.5,159.1,297,285.9,300.9,177,245.2,153.1,8.1,76.5,322.4,190.8,35.2,342.6,8.8,244.6,202,176.2,308.3,184.2,267.2,26.6,293.8,167.3,30.5,176,74.3,96.9,186.7,288.2,62.6,331.4,254.7,324.1,73.4,16.4,64,110.9,74.4,69.8,298.8,336.6,58.8,170.1,173.2,330.8,92.6,129.2,124.7,262.3,140.4,321.2,34,79.5,263,66.4,172.8,205.5,288,98.5,335.2,38.7,289.7,112.7,350.7,243.2,185.4,63.9,170.3,326.3,322.9,320.6,199.2,287.1,158.1)

EndID <- c(seq(1, 100, 1))

StID <- c(seq(1, 100, 1))

df <- cbind.data.frame(StPt, StID, EndPt, EndID)

#=========================================
# Convert polar coordinates to cartesian x,y data 
#=========================================
# Area that the transect occupy in space only used for graphing
planeDim <- 1
# Number of transects
nTransects <- 100

# Convert 360-degree polar coordinates to x,y cartesian coordinates to facilitate calculating a distance matrix based on the Pythagorean theorem
EndX <- as.matrix(pol2cart(planeDim, EndPt, degrees = TRUE)["x"])
EndY <- as.matrix(pol2cart(planeDim, EndPt, degrees = TRUE)["y"])
StX <- as.matrix(pol2cart(planeDim, StPt, degrees = TRUE)["x"])
StY <- as.matrix(pol2cart(planeDim, StPt, degrees = TRUE)["y"])

# Matrix of x,y pairs for the beginning ("b") and end ("e") points of each transect
b <- cbind(c(StX), c(StY))
e <- cbind(c(EndX), c(EndY))

#=========================================
# Function to calculate the distance from all endpoints in the ePts matrix to a single beginning point in bPt
#=========================================
dist <- function(ePts, bPt) {
  # Use the Pythagorean theorem to calculate the hypotenuse (i.e., distance) between every end point in the matrix ePts to the point bPt
  apply(ePts, 1, function(p) sum((p - bPt)^2)^0.5)
}

#=========================================
# Distance matrix
#=========================================
# Apply the "dist" function to all beginning points to create a matrix that has the distance between every start and endpoint
## Note: because this is an asymmetric traveling salesperson problem, the distance matrix is directional, thus, the distances at any position in the matrix must be the distance from the transect shown in the row label and to the transect shown in the column label
distMatrix <- apply(b, 1, FUN = dist, ePts = e)

## Set the distance between the beginning and end of each transect to zero so that there is no "cost" to walking the transect
diag(distMatrix) <- 0

#=========================================
# Solve asymmetric TSP
#=========================================
# This creates an instance of the asymmetric traveling salesperson (ASTP) 
atsp <- as.ATSP(distMatrix)
# This creates an object of Class Tour that travels to all of the points 
## In this case, the repetitive_nn produces the smallest overall and transect-to-transect
tour <- solve_TSP(atsp, method = "repetitive_nn")


#=========================================
# Create a path by cutting the tour at the most "expensive" transition 
#=========================================
# Sort the original data frame to match the order of the solution
dfTour = df[as.numeric(tour),]

# Add the following columns to the original dataframe: 
dfTour = dfTour %>%
  # Assign visit order (1 to 100, ascending) 
  mutate(visit_order = 1:nrow(dfTour)) %>%
  # The ID of the next transect to move to
  mutate(next_StID = lead(StID, order_by = visit_order),
  # The angle of the start point for the next transect
         next_StPt = lead(StPt, order_by = visit_order))

# lead() generates the NA's in the last record for next_StID, next_StPt, replace these by adding that information
dfTour[dfTour$visit_order == nrow(dfTour),'next_StID'] <-
  dfTour[dfTour$visit_order == 1,'StID']

dfTour[dfTour$visit_order == nrow(dfTour),'next_StPt'] <-
  dfTour[dfTour$visit_order == 1,'StPt']

# Function to calculate distance for 360 degrees rather than x,y coordinates
transect_distance <- function(end,start){
  abs_dist = abs(start-end)
  ifelse(360-abs_dist > 180, abs_dist, 360-abs_dist)
}

# Compute distance between end of each transect and start of next using polar coordinates
dfTour = dfTour %>% mutate(dist_between = transect_distance(EndPt, next_StPt))

# Identify the longest transition point for breaking the cycle
min_distance <- sum(dfTour$dist_between) - max(dfTour$dist_between)
path_start <- dfTour[dfTour$dist_between == max(dfTour$dist_between), 'next_StID']
path_end <- dfTour[dfTour$dist_between == max(dfTour$dist_between), 'EndID']

# Make a statement about the least cost path
print(sprintf("minimum cost path = %.2f, starting at node %d, ending at node %d",
              min_distance, path_start, path_end))

# The variable path shows the order in which you should visit the transects
path <- cut_tour(tour, path_start, exclude_cut = F) 

# Arrange df from smallest to largest travel distance
tmp1 <- dfTour %>%
  arrange(dist_between)

# Change dist_between and visit_order to NA for transect with the largest distance to break cycle 
# (e.g., we will not travel this distance, this represents the path endpoint) 
tmp1[length(dfTour$dist_between):length(dfTour$dist_between),8] <- NA
tmp1[length(dfTour$dist_between):length(dfTour$dist_between),5] <- NA

# Set df order back to ascending by visit order
tmp2 <- tmp1 %>%
  arrange(visit_order)

# Detect the break in a sequence of visit_order introduced by the NA (e.g., 1,2,3....5,6) and mark groups before the break with 0 and after the break with 1 in the "cont_per" column 
tmp2$cont_per <- cumsum(!c(TRUE, diff(tmp2$visit_order)==1))
# Sort "cont_per" such that the records following the break become the beginning of the path and the ones following the break represent the middle orders and the point with the NA being assigned the last visit order, and assign a new visit order
tmp3 <- tmp2%>%
  arrange(desc(cont_per))%>%
  mutate(visit_order_FINAL=seq(1, length(tmp2$visit_order), 1))

# Datframe ordered by progression of transects
trans_order <- cbind.data.frame(tmp3[2], tmp3[1], tmp3[4], tmp3[3], tmp3[6], tmp3[7], tmp3[8], tmp3[10])
# Insert NAs for "next" info for final transect
trans_order[nrow(trans_order),'next_StPt'] <- NA 
trans_order[nrow(trans_order), 'next_StID'] <- NA

#=========================================
# View data
#=========================================
head(trans_order)

#=========================================
# Plot
#=========================================
#For fun, we can visualize the transects:
# make an empty graph space
plot(1,1, xlim = c(-planeDim-0.1, planeDim+0.1), ylim = c(-planeDim-0.1, planeDim+0.1), ty = "n")

# plot the beginning of each transect as a green point, the end as a red point,
and a grey line representing the transect
for(i in 1:nrow(e)) {
  xs = c(b[i,1], e[i,1])
  ys = c(b[i,2], e[i,2])
  lines(xs, ys, col = "light grey", lwd = 1, lty = 1)
  points(xs, ys, col = c("green", "red"), pch = 1, cex = 1)
  #text((xs), (ys), i)
}

# Add the path to the visualization
for(i in 1:(length(path)-1)) {
    # This makes a line between the x coordinates for the end point of path i and beginning point of path i+1 
    lines(c(e[path[i],1], b[path[i+1],1]), c(e[path[i],2], b[path[i+1], 2]), lty = 1, lwd=1)
}

这是最终结果的样子。

enter image description here


网页内容由stack overflow 提供, 点击上面的
可以查看英文原文,
原文链接