如何在ggplot2的条形图中增加条之间的间距?
5个回答
79
您可以随时调整 width 参数,如下所示:
df <- data.frame(x=factor(LETTERS[1:4]), y=sample(1:100, 4))
library(ggplot2)
ggplot(data=df, aes(x=x, y=y, width=.5)) +
  geom_bar(stat="identity", position="identity") +
  opts(title="width = .5") + labs(x="", y="") +
  theme_bw()
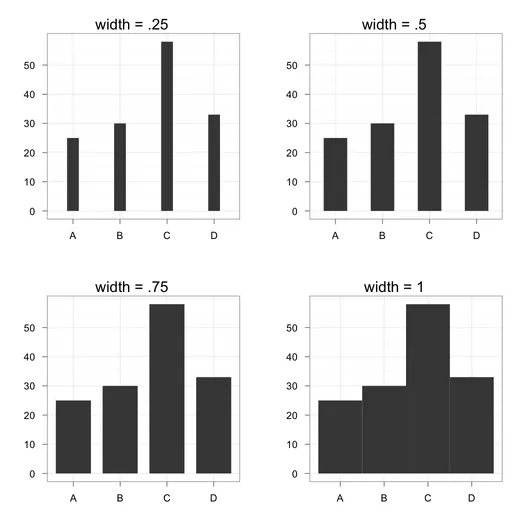
以下是width的其他设置对比:
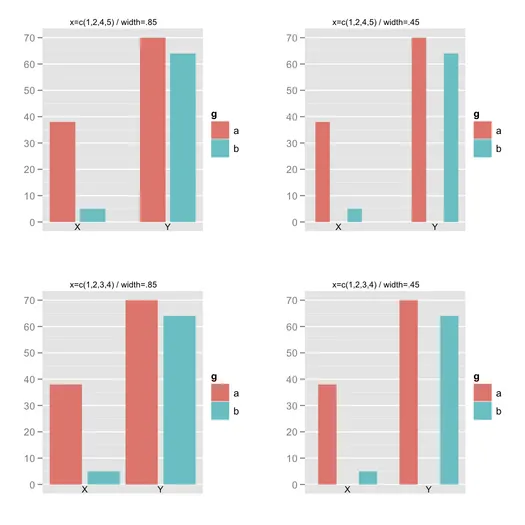
到目前为止,一切都很好。现在,假设我们有两个因素。如果您想玩均匀间隔的临近条形图(例如在barplot()中使用space和beside=TRUE),使用geom_bar(position="dodge")并不容易:您可以更改条形图的宽度,但无法在相邻的条形图之间添加空间(我在Google上没有找到方便的解决方案)。最终,我得到了类似于这样的结果:
df <- data.frame(g=gl(2, 1, labels=letters[1:2]), y=sample(1:100, 4))
x.seq <- c(1,2,4,5)
ggplot(data=transform(df, x=x.seq), aes(x=x, y=y, width=.85)) +
  geom_bar(stat="identity", aes(fill=g)) + labs(x="", y="") +
  scale_x_discrete(breaks = NA) +
  geom_text(aes(x=c(sum(x.seq[1:2])/2, sum(x.seq[3:4])/2), y=0,
                label=c("X","Y")), vjust=1.2, size=8)
在数据框中,“x”轴使用的向量是“注入”的,因此如果需要更改外部间距,则可以更改。而width允许控制内部间距。使用scale_x_discrete()可以增强“x”轴的标签。
- chl
2
1显然,在R 4.0及以上版本中,
opts已经不存在了。 - Denis Cousineau1从ggplot 3.0.0版本开始,你可以使用
position_dodge2。它接受一个padding参数,用于在柱状图之间添加间距。请参考下面的回答。 - undefined60
使用空格来分隔因子条
ggplot(data = d, aes(x=X, y=Y, fill=F))
 + geom_bar(width = 0.8, position = position_dodge(width = 0.9))
在geom_bar中,width参数控制条形宽度相对于x轴的比例;而在position_dodge中,width参数则控制给两个条形之间空白区域的宽度,同样是相对于x轴。可以尝试调整该参数,找到自己喜欢的宽度。
- OliE
3
非常感谢chl.!我遇到了同样的问题,你帮助我解决了它。我使用scale_x_continuous(见下文)来添加X标签,而不是使用geom_text。
geom_text(aes(x=c(sum(x.seq[1:2])/2, sum(x.seq[3:4])/2), y=0,
            label=c("X","Y")), vjust=1.2, size=8)
被替换为
scale_x_continuous(breaks=c(mean(x.seq[1:2]), mean(x.seq[3:4])), labels=c("X", "Y"))
- Ralph
1
要在POSIXlt条之间获得间隔,您需要根据一天中的秒数调整宽度。
# POSIXlt example: full & half width
d <- data.frame(dates = strptime(paste(2016, "01", 1:10, sep = "-"), "%Y-%m-%d"),
            values = 1:10)

ggplot(d, aes(dates, values)) +
  geom_bar(stat = "identity", width = 60*60*24)

ggplot(d, aes(dates, values)) +
  geom_bar(stat = "identity", width = 60*60*24*0.5)
- KERO
1
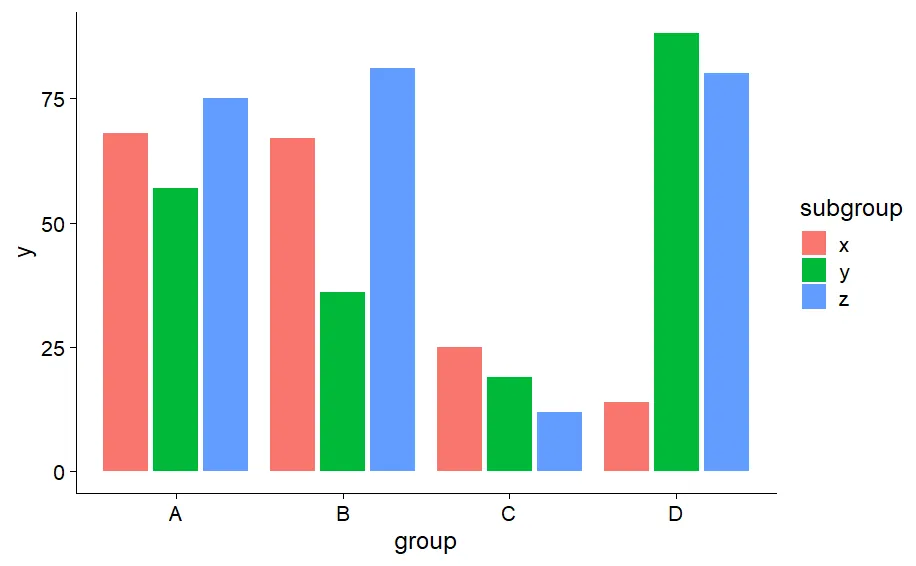
从ggplot 3.0.0开始,你可以使用
position_dodge2。它接受一个padding参数,用于在柱状图之间添加间距。library(ggplot2) # version >= 3.0.0
set.seed(1530676800) #
tib <- tibble(
group=rep(LETTERS[1:4], each=3),
subgroup=rep(letters[24:26], 4),
y=sample(1:100, 4*3)
)
ggplot(tib, aes(x=group, fill=subgroup, y=y)) +
geom_col(position=position_dodge2())
library(purrr)
library(cowplot)
theme_set(theme_cowplot())
n_col <- 2
bottom_row_starts <- 3
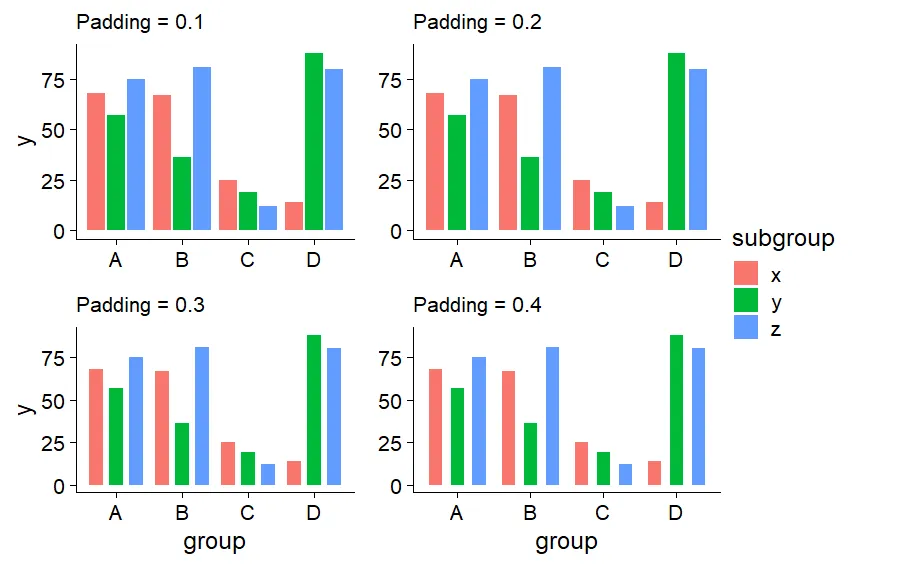
plots0 <- purrr::imap(0.1*c(1:4), \(pad, idx) {
ret <- ggplot(tib, aes(x=group, fill=subgroup, y=y)) +
geom_col(position=position_dodge2(padding=pad)) +
labs(subtitle=paste0("Padding = ", pad)) #+
#theme(plot.margin = margin(6, 0, 6, 0))
if (bottom_row_starts > idx) {
ret <- ret + xlab(NULL)
}
if(1 != (idx %% n_col)) {
ret <- ret + ylab(NULL)
}
return(ret)
})
leg <- cowplot::get_legend(plots0[[1]])
plots <- plots0 %>% purrr::map(\(pp) {
pp + theme(legend.position="none")
})
cowplot::plot_grid(
plotlist=plots,
ncol=n_col
) %>% cowplot::plot_grid(
leg,
rel_widths = c(4, 1)
)
- flies
网页内容由stack overflow 提供, 点击上面的可以查看英文原文,
原文链接
原文链接