我使用ggplot2包中的plot函数生成了一张直方图:
并使用gplots包中的textplot函数生成了一个表格
我希望能将它们显示在同一个pdf或png文件中。我试过使用grid.arrange,但没有成功。你有其他建议吗?由于每个表格仅有5行,所以考虑将其作为“图例”或文本框插入到qplot的边缘。如何使其看起来好看?感谢您的建议。
解决方法##
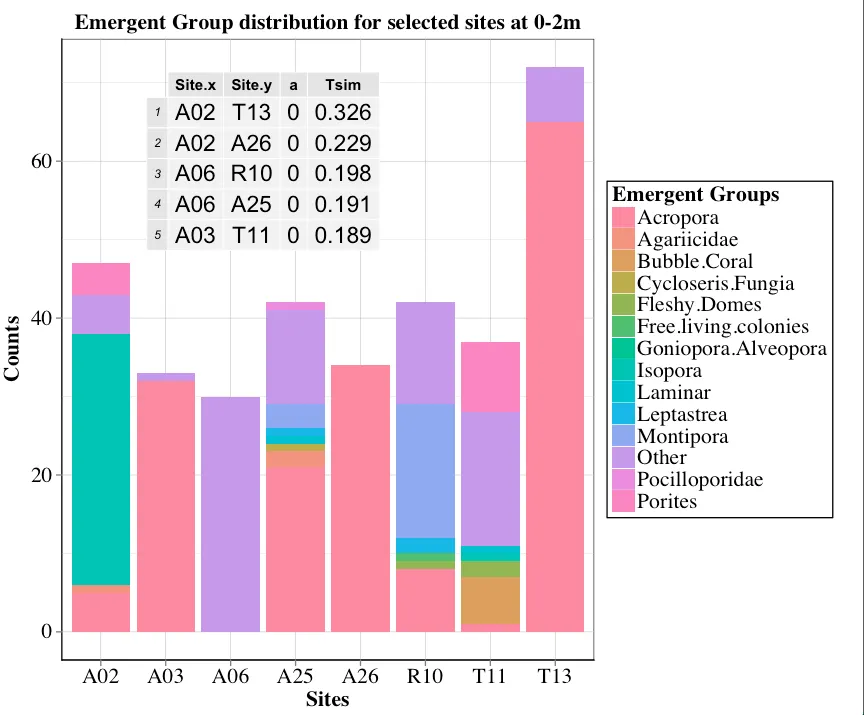
最终,我选择了插图,不幸的是我的颜色方案看起来更糟糕了……我已经发布了这个问题,作为一个新的问题。
library(ggplot2)
library(gridExtra)

g = tableGrob(iris[1:2, 1:2])

p = qplot(1:10, 1:10, geom = "blank") +
     annotation_custom(g) # as inset

grid.arrange(p, g, ncol=1) # stacked
ggsave("plot-table.pdf", arrangeGrob(p, g, ncol=1))
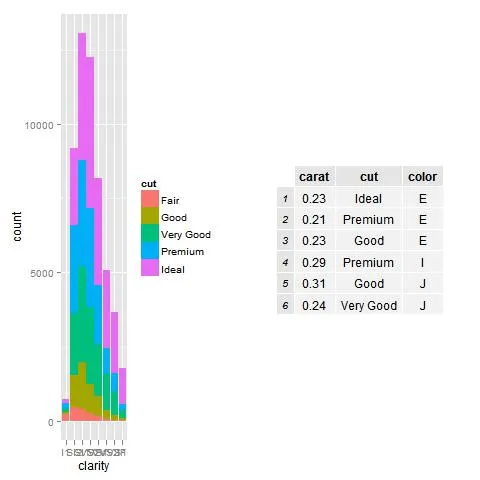
my_hist<-ggplot(diamonds, aes(clarity, fill=cut)) + geom_bar()
my_table<- tableGrob(head(diamonds)[,1:3],gpar.coretext = gpar(fontsize=8),gpar.coltext=gpar(fontsize=8), gpar.rowtext=gpar(fontsize=8))
pdf("myplot.pdf")
grid.arrange(my_hist,my_table, ncol=2)
dev.off()
您可以在表格中更改字体大小和pdf的大小:pdf("myplot.pdf",width=10, height = 6)
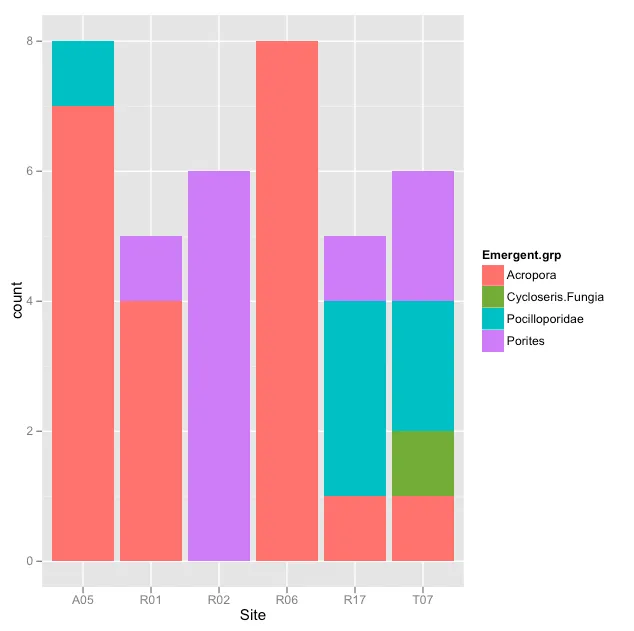
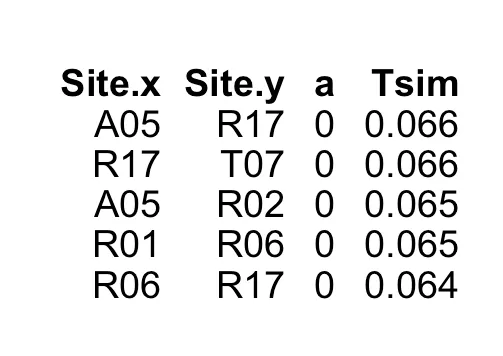
如果您喜欢不同的排列方式,您可能还需要一个空白面板:
blankPanel<-grid.rect(gp=gpar(col="white"))
grid.table制作表格,然后在grid.arrange中使用它吗? - joran