我想从我手头的数据框中构建一个网络图,但是遇到了麻烦。
这就是数据框的样子。
| 店铺 | 经理 |
|---|---|
| S1 | 34 |
| S1 | 12 |
| S2 | 11 |
| S2 | 34 |
| S3 | 34 |
| S4 | 50 |
例如,由于他们有相同的经理,S1应该连接到S2和S3等等。此外,是否可以根据商店拥有的经理数量设置节点大小?
非常感谢帮助。谢谢!
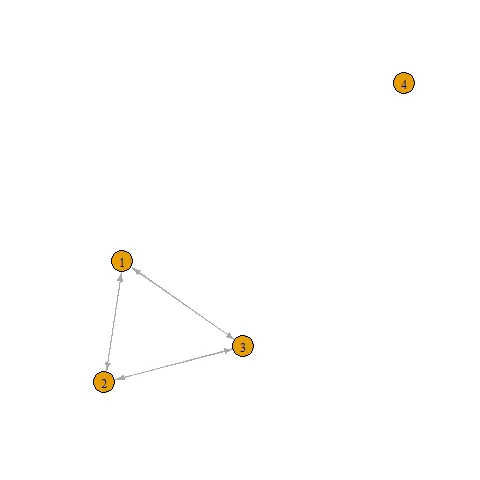
graph_from_adjacency_matrix+tcrossprod+table。library(igraph)
g <- graph_from_adjacency_matrix(as.dist(tcrossprod(table(df))))
plot(g) 显示了像下面这样的网络
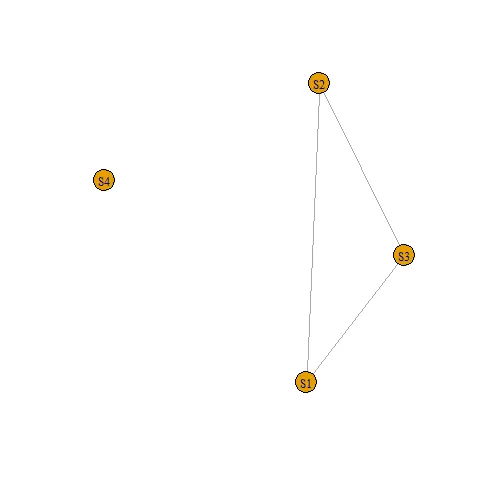
另一种方法是使用 bipartite.projection
df %>%
  graph_from_data_frame() %>%
  set_vertex_attr(name = "type", value = names(V(.)) %in% df$Shop) %>%
  bipartite.projection() %>%
  pluck(2) %>%
  plot()
数据
> dput(df)
structure(list(Shop = c("S1", "S1", "S2", "S2", "S3", "S4"),
    Manager = c(34L, 12L, 11L, 34L, 34L, 50L)), class = "data.frame", row.names = c(NA,
-6L))
bipartite_projection 函数(我没有尝试过,但是 OP 所要求的操作是二分图投影)。 - Szabolcsbipartite.projection 选项。 - ThomasIsCoding