在ggplot中绘制此图。控制y轴线在一定范围内。

9

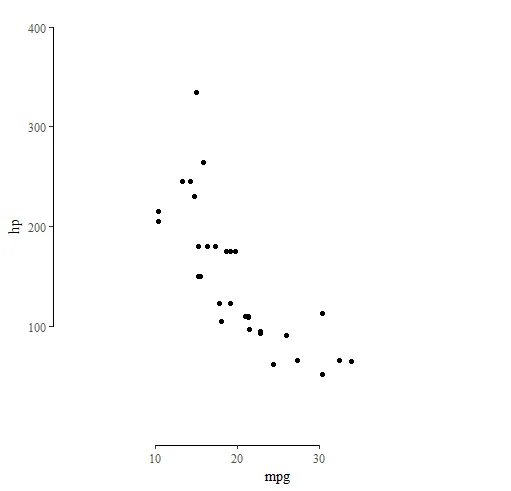
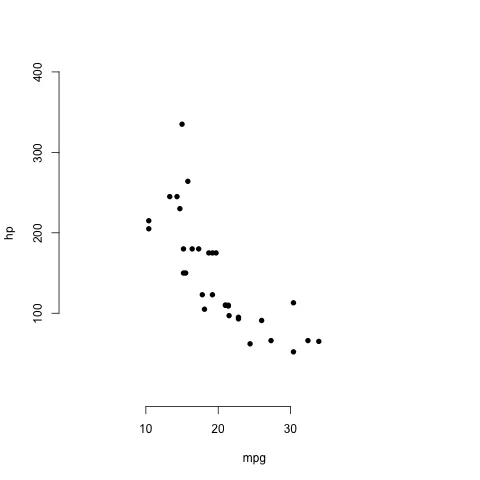
这是使用基础绘图,我可以控制x和y轴范围,确定线应该绘制在哪里。

plot(mtcars$mpg, mtcars$hp, ylim = c(0, 400), xlim = c(0, 50), axes = F, xlab  = 'mpg', ylab = 'hp', pch = 16)
axis(side = 2, at = seq(100, 400, 100))
axis(side = 1, at = seq(10, 30, 10))

enter image description here

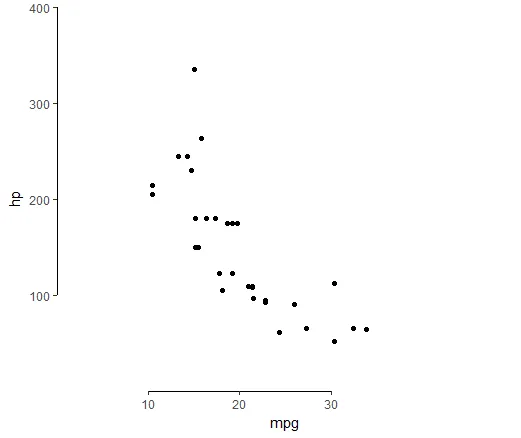
ggplot(data = mtcars, aes(x = mpg, y = hp))+geom_point()+
theme(panel.background = element_blank())+
scale_x_continuous(breaks = seq(10, 30, 10), limits = c(0, 50))+
scale_y_continuous(breaks = seq(100, 400, 100), limits = c(0, 400))

在此输入图片描述

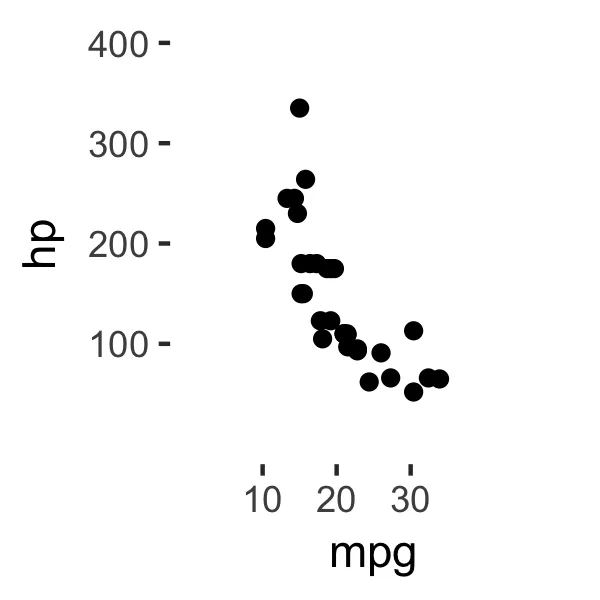
我该如何添加和base plot一样精确的轴线?我尝试了scale_y_continuousscale_x_continuous,但它总是绘制到图形的末尾。

2个回答

9

您可以使用ggthemes包实现:

library(ggthemes)
ggplot(data = mtcars, aes(x = mpg, y = hp)) + 
  geom_point() +
  geom_rangeframe(data = data.frame(mpg = c(10, 30), hp = c(100, 400))) +
  theme_tufte() +
  scale_x_continuous(breaks = seq(10, 30, 10), limits = c(0, 50))+
  scale_y_continuous(breaks = seq(100, 400, 100), limits = c(0, 400))

这里输入图片描述

如果您愿意,您也可以手动绘制它们:

ggplot(data = mtcars, aes(x = mpg, y = hp)) + 
  geom_point() +
  geom_segment(
    aes_all(c('x', 'y', 'xend', 'yend')),
    data.frame(x = c(0, 10), xend = c(0, 30), y = c(100, 0), yend = c(400, 0))
  ) +
  theme(panel.background = element_blank()) +
  scale_x_continuous(breaks = seq(10, 30, 10), limits = c(0, 50), expand = c(0, 0))+
  scale_y_continuous(breaks = seq(100, 400, 100), limits = c(0, 400), expand = c(0, 0))

enter image description here


谢谢,我之前已经尝试过(使用 theme_hc())。但我想不使用 ggthemes 来完成这个。这可能吗? - PoisonAlien
我想当比例尺展开时,你可以手动绘制线段。 - Axeman
是的,这正是我想的。我会尝试一下。令人惊讶的是,ggplot 作为一个成熟的工具,竟然没有这个选项。 - PoisonAlien
@PoisonAlien,看一下编辑。值得一提的是,ggplot是可扩展的,这是有原因的;我认为有意识地选择不在主包中包含很多东西,而是保持包的精简,并为用户提供附加组件。 - Axeman
有道理。毕竟它上面有很多附加组件。感谢您的编辑。它有效了。 - PoisonAlien

1

一个简单的方法是使用ggh4x包中的guide_axis_truncated()函数修改x轴和y轴的指南。如果您想要截断轴而没有精细控制,可以在设置xy指南时直接传递"value"参数为"axis_truncated":

library(ggplot2)
library(ggh4x)

ggplot(data = mtcars, aes(x = mpg, y = hp)) +
  geom_point() +
  guides(x = "axis_truncated", y = "axis_truncated") +
  theme_classic()

reprex package (v2.0.1)于2022年9月25日创建


网页内容由stack overflow 提供, 点击上面的
可以查看英文原文,
原文链接