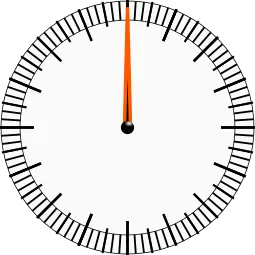
以编程方式绘制速度计的亮部分
3
 -
- 
- Alejandro
6
1请提供您想要实现的内容的屏幕截图/GIF/视频。 - Mitch
我想这可以很容易地通过使用Image和其中一种动画效果来完成。当然,这是在纯QML中实现的。 - folibis
@Mitch:添加了图片链接。 - Alejandro
@folibis:我会查看你建议的“Animations”,谢谢。 - Alejandro
@folibis 我希望这些片段保持亮着,所以我不认为你的建议适合我(或者我还没有理解如何操作)。 - Alejandro
我编辑了这个问题,给它一个更具描述性的标题;希望你不介意! - Mitch
1个回答
4
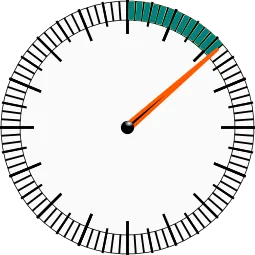
您可以使用Canvas元素轻松绘制一条弧线,并控制其起始和结束位置。只需在量表的比例下方组合这个元素。
这是一个示例,演示如何使用0到1之间的值来选择量表有多“满”。
ApplicationWindow {
    visible: true
    width: 500
    height: 500

    Canvas {
        id: canvas
        anchors.fill: parent
        rotation: -90

        onPaint: {
            var c = getContext('2d')
            c.clearRect(0, 0, width, height)
            c.beginPath()
            c.lineWidth = 30
            c.strokeStyle = "red"
            c.arc(250, 250, 250 - 15, 0, Math.PI * 2 * circ.value)
            c.stroke()
        }
    }

    Slider {
        id: circ
        minimumValue: 0
        maximumValue: 1
        value: maximumValue / 2
        onValueChanged: canvas.requestPaint()
    }
}
按照Mitch的要求,我解释一下 - 画布以90度逆时针旋转是因为Qt绘制弧线的方式 - 它们不是从“12点钟”开始,而是从3点钟开始。如果您需要绘制额外的内容,可以删除画布的旋转,因为您不希望所有的图形都偏移90度才能与旋转的画布相匹配。您只需要在范围内绘制弧线
-Math.PI * 0.5到Math.PI * 1.5来处理从3点钟开始的弧线即可。- dtech
2
+1 给 Canvas。 :) 这几乎是我会做的方式,除了旋转技巧;如果绘制某些东西(比如文本),这将导致不希望的旋转。你可以提到为什么在这里旋转,这样人们就知道它的存在以及我刚才提到的副作用。 - Mitch
这个解决方案虽然不是完全准确的,但非常好。此外,它给了我一个想法,即在Canvas的onPaint中替换弧形绘制为重复绘制旋转图像,以防万一我绝对需要。 - Alejandro
网页内容由stack overflow 提供, 点击上面的可以查看英文原文,
原文链接
原文链接