在ggplot2中手动指定刻度标签

4
在ggplot2中,我有一个图表,其y轴是基于log10(x+1)的。我没有找到一种直接指定ggplot2使用log10(x+1)刻度的方法,因此我想直接修改y轴刻度标签,使这些刻度读作“0、3.2、10、32和100”,而不是“0、0.5、1、1.5和2”。有简单的方法可以实现这个吗?
代码:
  ibero.all <- ggplot(melted.LOG.Ibero, aes(colour=cultures, x = factor(Laplace, levels=c("B", "G", "T", "Bc", "PD.LD", "DT6", "DT1.5.7.8", "Gm1", "Gm2.8", "F", "P", "L.R", "A", "D", "Dv")), y = Frequency)) + 
  geom_point(position = position_dodge(width = 0.4))+
  scale_color_manual(name="", values=group.colors.Ibero)+
  ylim(0, 2)+
  labs(y = "Percentage of the toolkit", x="Typed tool classes (Laplace 1964)")+
  ggtitle("Madeleine clones of sample size 100, tool frequencies (log scale)")+
  theme(plot.title = element_text(hjust = 0.5))

我想仅更改刻度标签的样式,使它们看起来像这样:
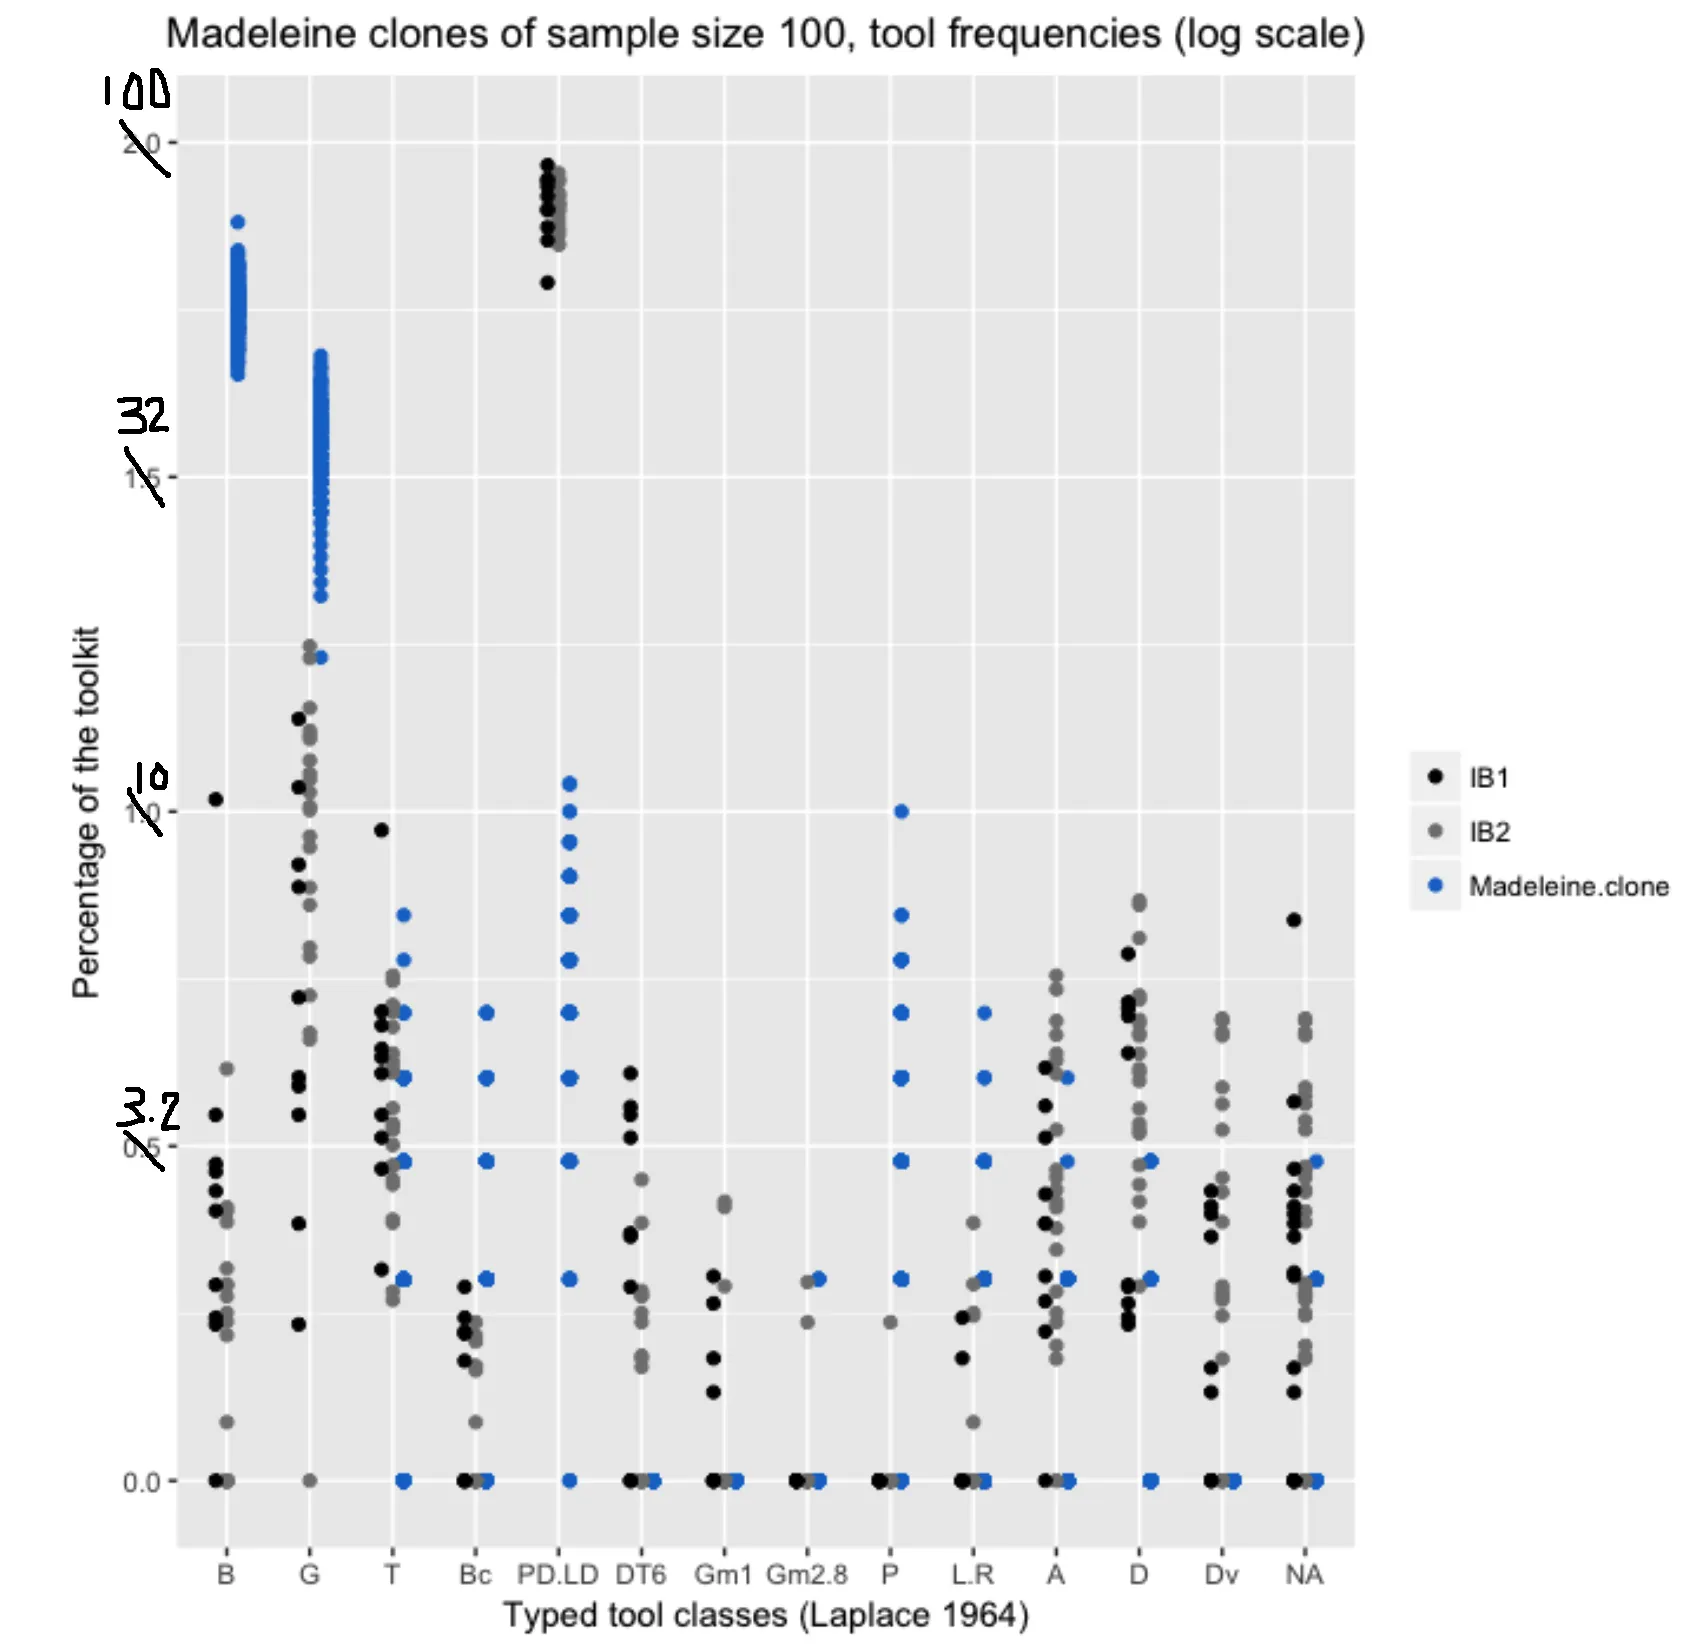
 enter image description here
2个回答

4

你需要手动为log10断点添加标签。

scale_y_continuous(breaks = log10(c(0, 3.2, 10, 32, 100),
                   labels = c(0, 3.2, 10, 32, 100))

请注意,您正在进行一种误导性的做法: 轴断点被转换为log10(x),而不是log10(x + 1)。您的轴与绘制的值不在同一个测量刻度上。


1
非常正确,坐标轴标签应该是c(0、2.2、9、31、99)。做得好。 - Pertinax

3
你可以通过 scale_<aes>_<type> 函数手动设置坐标轴标签:
scale_y_continuous(breaks = c(0, 3.2, 10, 32, 100))

您也可以使用log10函数来标记您的坐标轴:
scale_y_continuous(trans = 'log10')

很抱歉,使用scale_y_continuous(breaks = c(0, 1, 3.2, 10, 32, 100))(其中“1”仅用于说明),刻度线会超出边界:https://ibb.co/mJ0YXc - Pertinax
@TheThunderChimp 你需要指定“limits”,这样才能强制显示它们。轴将自动按比例缩放到数据。 - konvas
@konvas 如果我使用scale_y_continuous(breaks = c(0, 1, 3.2, 10, 32, 100), limits=c(0,100)),我会得到这个结果:https://ibb.co/bD0g2c 我也不能使用scale_y_continuous(trans='log10'),因为我有很多值是零。我需要一个log10(x+1)的转换。 - Pertinax

网页内容由stack overflow 提供, 点击上面的
可以查看英文原文,
原文链接