我使用Spyder环境中的Python代码来绘制二进制图像中检测到的组件的轮廓,参考了http://docs.opencv.org/trunk/d4/d73/tutorial_py_contours_begin.html提供的示例。以下是我的代码:
im = cv2.imread('test.jpg') #raw RGB image
im2 = cv2.cvtColor(im,cv2.COLOR_BGR2GRAY) #gray scale image
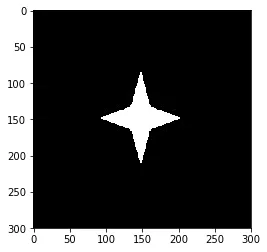
plt.imshow(im2,cmap = 'gray')
The image is shown as follows:
Then,
thresh, im_bw = cv2.threshold(im2, 127, 255, cv2.THRESH_BINARY) #im_bw: binary image
im3, contours, hierarchy = cv2.findContours(im_bw,cv2.RETR_TREE, cv2.CHAIN_APPROX_NONE)
cv2.drawContours(im2, contours, -1, (0,255,0), 3)
plt.imshow(im2,cmap='gray')  #without the code, only an array displayed in the console
这些代码出于某种原因无法给出轮廓图。但如果我将代码的最后两行更改如下:
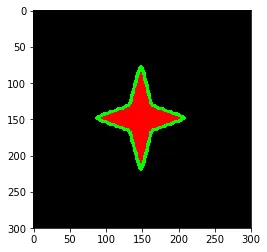
cv2.drawContours(im, contours, -1, (0,255,0), 3)
plt.imshow(im,cmap='gray')
这段代码产生了一个带轮廓的图形:
我对这些代码如何工作感到困惑?cv2.drawContours只适用于GRB图像吗?希望不是。 此外,需要注意的是contours[0]会产生一个3D数组:
idx = contours[0]
print idx.shape

(392L, 1L, 2L)
idx应该存储所有轮廓点的像素坐标。但是如何解释每个维度表示什么,并从中获取每个轮廓点的像素坐标?然后我就可以使用这些坐标绘制轮廓,而不必使用cv2.drawContours。