我正在尝试在ggplot中绘制一些与英国和爱尔兰有关的地理位置数据。运行以下代码,我可以成功地将此制表符分隔文件中的某些值映射到这里找到的GBR shapefile数据(国家=大不列颠):
library(rgdal)
library(ggplot2)
library(rgeos)
library(plyr)

#this data comes from http://www.gadm.org/country (download the Great Britain data set, and set path to the downloaded data's topmost directory)
shape.dir <- "C:\\Users\\Douglas\\Desktop\\estc_clean_analysis\\geoanalysis\\GBR_adm"

#the first parameter we pass to readOGR species the location of the shapefile we want to read in; layer indicates which shapefile in that dir we want to read in. Data via UK shapefile from http://www.gadm.org/country
uk.shp <- readOGR(shape.dir, layer = "GBR_adm2")

#read in csv with values by county
small_geo_data <- read.csv(file = "small_geo_sample.txt", header=TRUE, sep="\t", na.string=0, strip.white=TRUE)

#fortify prepares the data for ggplot
uk.df <- fortify(uk.shp, region = "ID_2") # convert to data frame for ggplot

#now combine the values by id values in both dataframes
combined.df <- join(small_geo_data, uk.df, by="id")

#now build plot up layer by layer
ggp <- ggplot(data=combined.df, aes(x=long, y=lat, group=group))
ggp <- ggp + geom_polygon(aes(fill=value))         # draw polygons
ggp <- ggp + geom_path(color="grey", linestyle=2)  # draw boundaries
ggp <- ggp + coord_equal()
ggp <- ggp + scale_fill_gradient(low = "#ffffcc", high = "#ff4444",
                                 space = "Lab", na.value = "grey50",
                                 guide = "colourbar")
ggp <- ggp + labs(title="Plotting Values in Great Britain")
# render the map
print(ggp)
运行该代码会产生以下结果: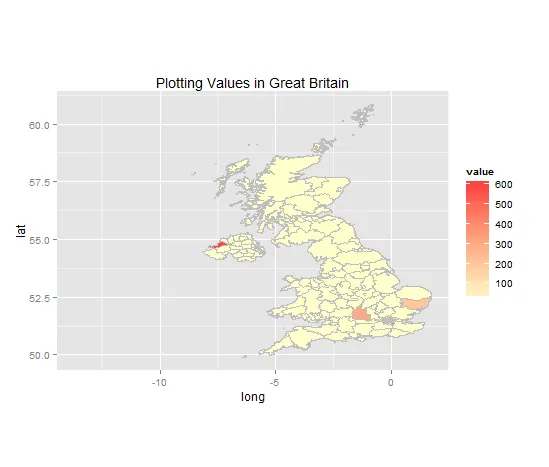
现在我想要做的是将有关爱尔兰的数据添加到我的图表中。我从同一网站下载了“IRL”形状文件,该网站提供了GBR形状文件,但接下来我遇到了一系列障碍。我尝试结合IRL_adm1.csv和GBR_adm2.csv(将前者中的id值重命名以避免冲突),但什么都没成功。在继续寻找笨拙的解决方案之前,我想在SO上发表以下问题:是否有一个相对简单的方法来将GBR和IRL文件组合在一个图表中?如果其他人能够提供任何想法或建议,我将非常感激。