如果我绘制一个二维数组并对其进行等高线图绘制,可以通过
非常感谢!
cs = plt.contour(...); cs.allsegs访问分割地图,但其被参数化为一条线。我想获取一个segmap布尔掩码,表示线内部的内容,这样我就可以快速对该轮廓内的所有内容进行求和。非常感谢!
cs = plt.contour(...); cs.allsegs访问分割地图,但其被参数化为一条线。我想获取一个segmap布尔掩码,表示线内部的内容,这样我就可以快速对该轮廓内的所有内容进行求和。我认为没有很简单的方法,主要是因为你想要混合栅格和矢量数据。幸运的是,Matplotlib路径有一种方法可以检查点是否在路径内,在所有像素上执行此操作将生成掩码,但我认为对于大型数据集来说,这种方法可能会变得非常缓慢。
import matplotlib.patches as patches
from matplotlib.nxutils import points_inside_poly
import matplotlib.pyplot as plt
import numpy as np
# generate some data
X, Y = np.meshgrid(np.arange(-3.0, 3.0, 0.025), np.arange(-3.0, 3.0, 0.025))
Z1 = mlab.bivariate_normal(X, Y, 1.0, 1.0, 0.0, 0.0)
Z2 = mlab.bivariate_normal(X, Y, 1.5, 0.5, 1, 1)
# difference of Gaussians
Z = 10.0 * (Z2 - Z1)
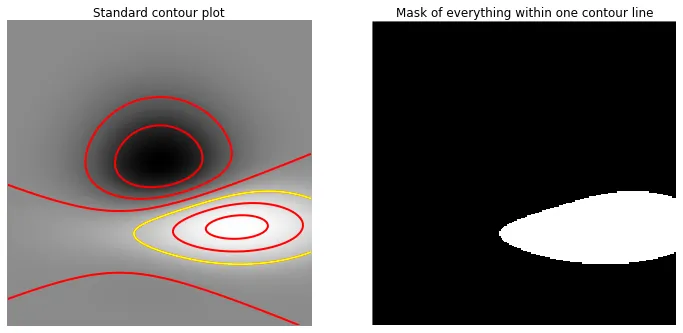
fig, axs = plt.subplots(1,2, figsize=(12,6), subplot_kw={'xticks': [], 'yticks': [], 'frameon': False})
# create a normal contour plot
axs[0].set_title('Standard contour plot')
im = axs[0].imshow(Z, cmap=plt.cm.Greys_r)
cs = axs[0].contour(Z, np.arange(-3, 4, .5), linewidths=2, colors='red', linestyles='solid')
# get the path from 1 of the contour lines
verts = cs.collections[7].get_paths()[0]
# highlight the selected contour with yellow
axs[0].add_patch(patches.PathPatch(verts, facecolor='none', ec='yellow', lw=2, zorder=50))
# make a mask from it with the dimensions of Z
mask = verts.contains_points(list(np.ndindex(Z.shape)))
mask = mask.reshape(Z.shape).T
axs[1].set_title('Mask of everything within one contour line')
axs[1].imshow(mask, cmap=plt.cm.Greys_r, interpolation='none')
# get the sum of everything within the contour
# the mask is inverted because everything within the contour should not be masked
print np.ma.MaskedArray(Z, mask=~mask).sum()
scipy.ndimage.measurements.label,它基本上可以生成我需要的轮廓掩模。当然,使用另一个包并不是我希望做的事情,但还是非常感谢! - Chris另一种更直观的方法是使用scipy.ndimage中的binary_fill_holes函数。
import numpy as np
import scipy


image = np.zeros((512, 512))
image[contour1[:, 0], contour1[:, 1]] = 1
masked_image = scipy.ndimage.morphology.binary_fill_holes(image)
```
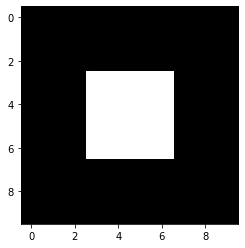
以下是使用OpenCV从轮廓创建填充多边形并创建二进制掩码的方法:
import cv2
import numpy as np
import matplotlib.pyplot as plt

mask = np.zeros((10,10,3), dtype=np.uint8)
# polygon's coordinates
coords = np.array([[3,3],[3,6],[6,6],[6,3]])

cv2.drawContours(mask, [coords], contourIdx=-1, color=(1,1,1), thickness=-1)
bin_mask = mask[:,:,0].astype(np.float32)
plt.imshow(bin_mask, cmap='gray')
contourIdx=-1 - 绘制所有轮廓
color=(1,1,1) - 每个通道的值从0到255;由于我们生成了一个二进制掩模,因此设置为1
thickness=-1 - 填充多边形