如何将一维向量f(r)转换为具有对称旋转的图像,我正在使用Python 2.7。
我想要的是一个带有左侧向量的右侧图像:
非常感谢。
如何将一维向量f(r)转换为具有对称旋转的图像,我正在使用Python 2.7。
我想要的是一个带有左侧向量的右侧图像:
非常感谢。
import numpy as np
import matplotlib.pyplot as plt
def centeredDistanceMatrix(n):
# make sure n is odd
x,y = np.meshgrid(range(n),range(n))
return np.sqrt((x-(n/2)+1)**2+(y-(n/2)+1)**2)
def function(d):
return np.log(d) # or any function you might have
d = centeredDistanceMatrix(101)
f = function(d)
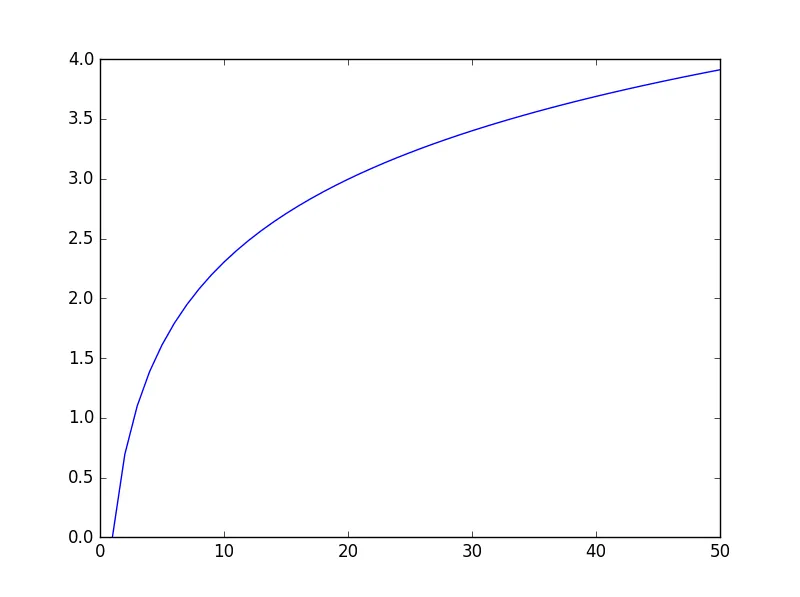
plt.plot(np.arange(51),function(np.arange(51)))
plt.show()
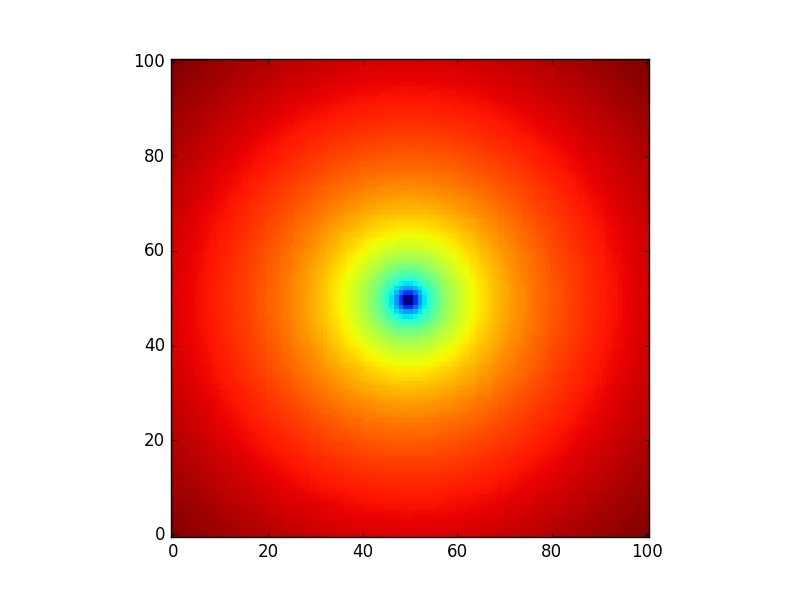
plt.imshow(f.T,origin='lower',interpolation='nearest')
plt.show()
这将导致:
和:
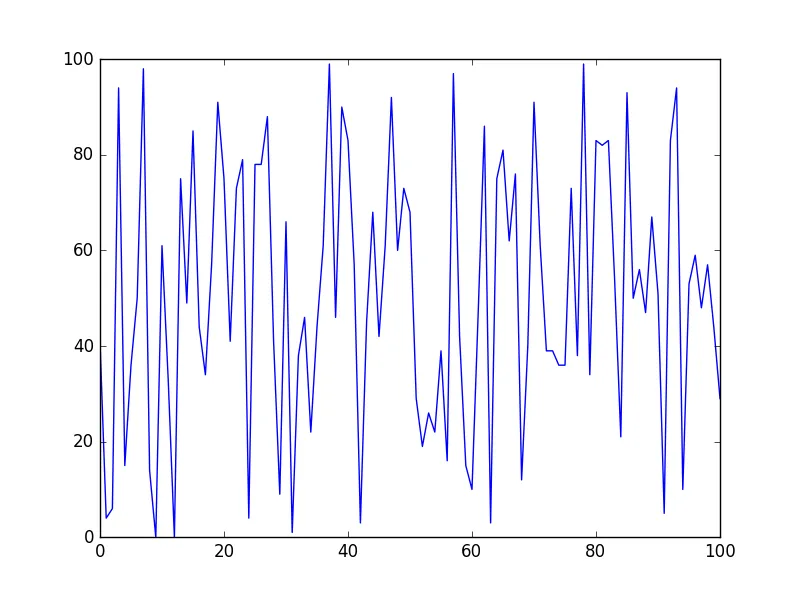
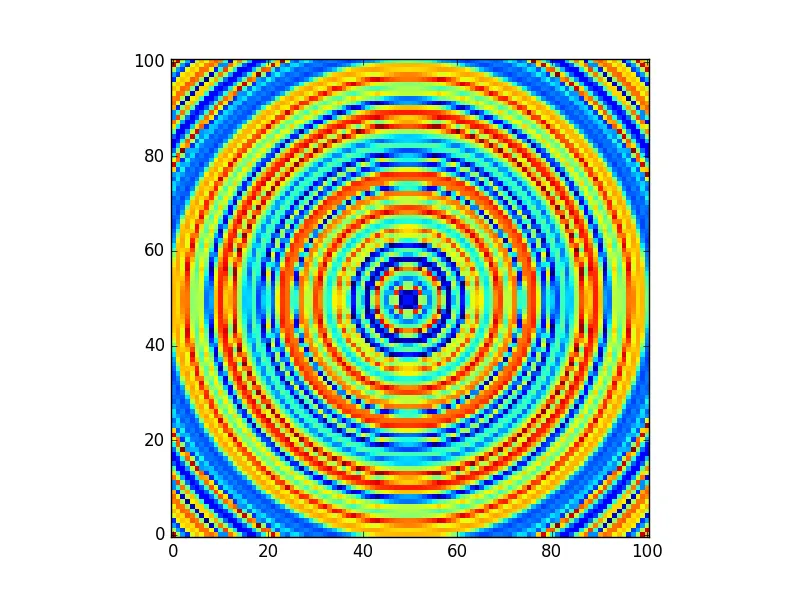
编辑:对于任意数据。
您可以使用interp1D将您的向量传递给函数,以便提供像素值。
import numpy as np
import matplotlib.pyplot as plt
from scipy.interpolate import interp1d

def centeredDistanceMatrix(n):
    # make sure n is odd
    x,y = np.meshgrid(range(n),range(n))
    return np.sqrt((x-(n/2)+1)**2+(y-(n/2)+1)**2)

def function(d):
    return np.log(d) # or any funciton you might have

def arbitraryfunction(d,y,n):
    x = np.arange(n)
    f = interp1d(x, y)
    return f(d.flat).reshape(d.shape)

n = 101
d = centeredDistanceMatrix(n)
y = np.random.randint(0,100,n) # this can be your vector
f = arbitraryfunction(d,y,n)
plt.plot(np.arange(101),arbitraryfunction(np.arange(n),y,n))
plt.show()
plt.imshow(f.T,origin='lower',interpolation='nearest')
plt.show()
结果就是这样:
和这个:
from pylab import*
x=linspace(-10,10,200)
y=linspace(-10,10,200)
xx,yy=meshgrid(x,y)
z=sin((xx**2.0+yy**2.0)**0.5)
imshow(z)
show()
r= ((x**2 + y**2 ) **0.5)
f(x,y)=sin( ((x**2 + y**2 ) **0.5) )
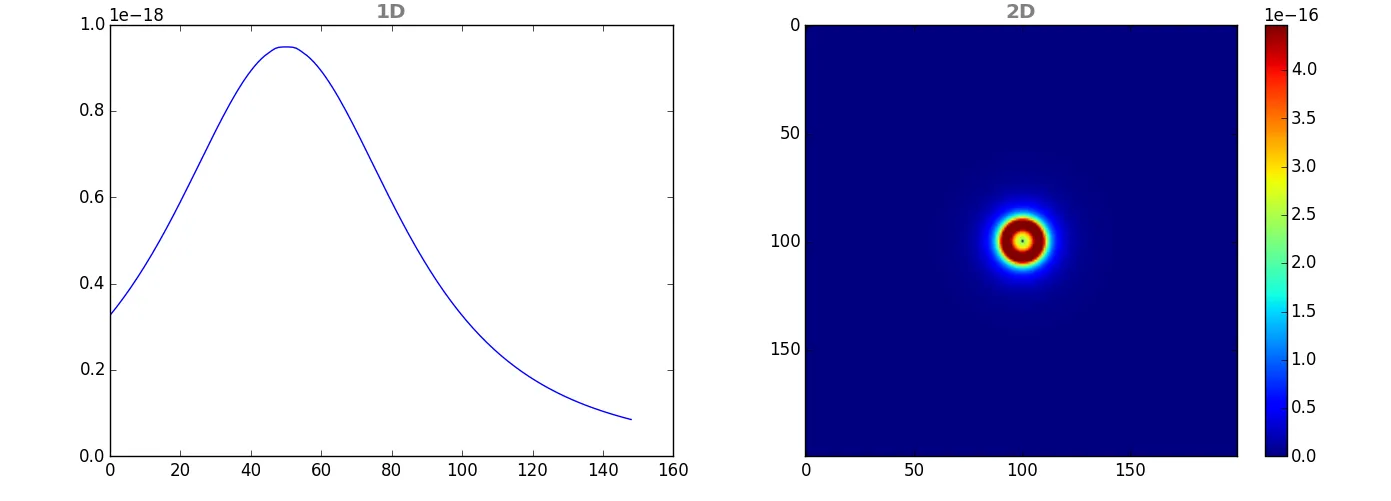
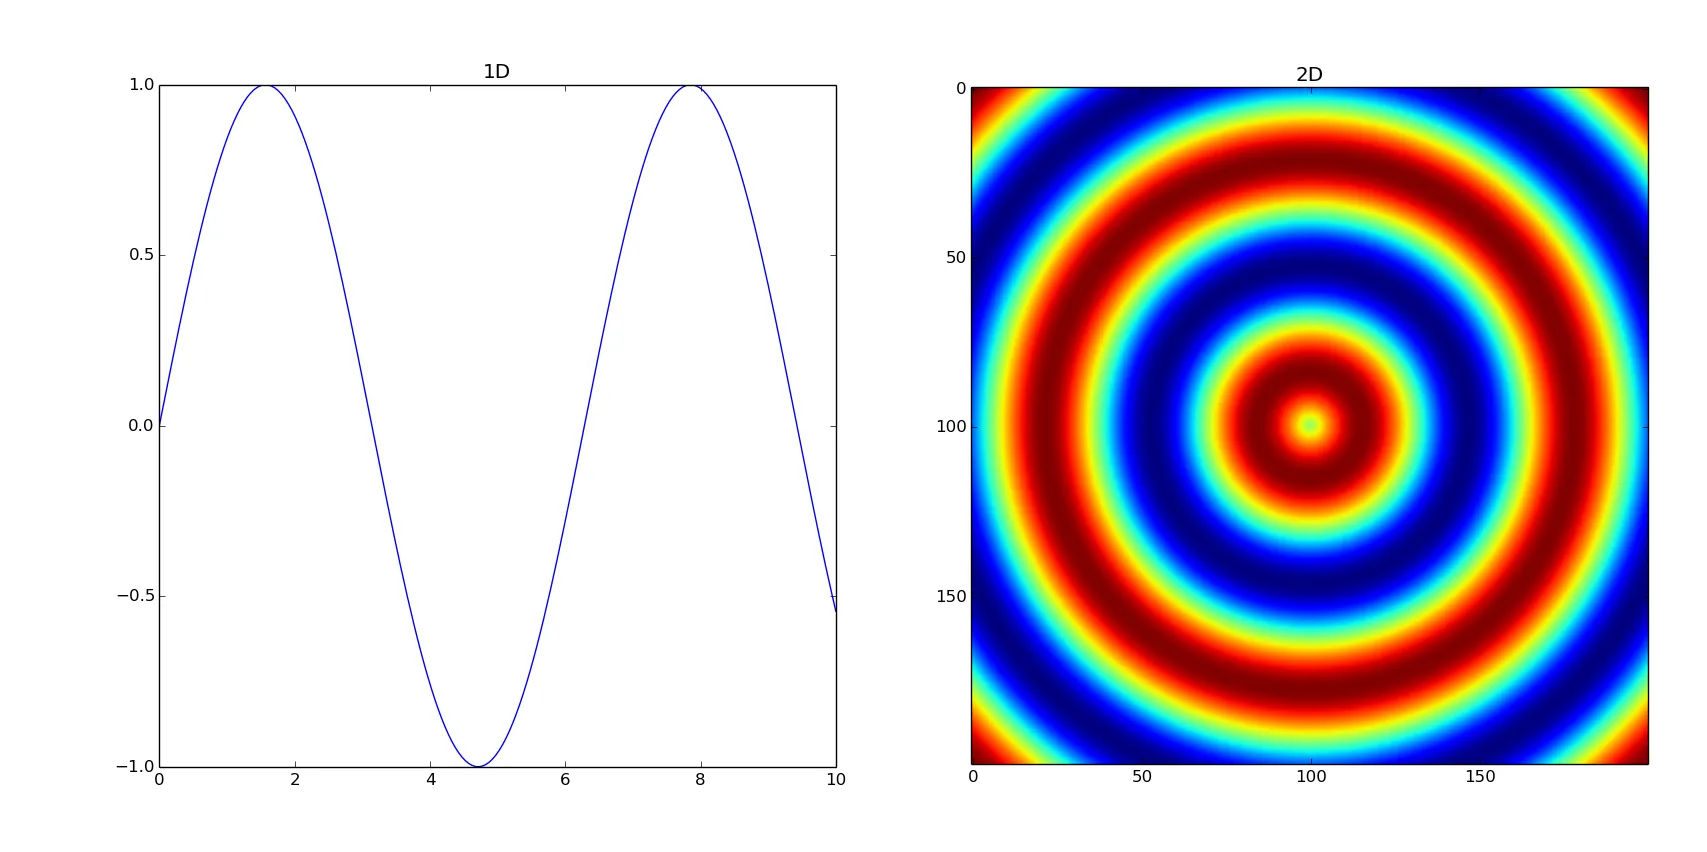
为了在同一帧中绘制这两个图形,它们可以作为子图添加到主框架中。
from pylab import*

fig = figure()
sub1 = fig.add_subplot(121)
sub2 = fig.add_subplot(122)

r=linspace(0,10,200)
fr=sin(r)
sub1.plot(r,fr)

x=linspace(-10,10,200)
y=linspace(-10,10,200)
xx,yy=meshgrid(x,y)
z=sin((xx**2.0+yy**2.0)**0.5)
sub2.imshow(z)

sub1.set_title('1D')
sub2.set_title('2D')

show()