合并两个补丁以供传奇使用

10
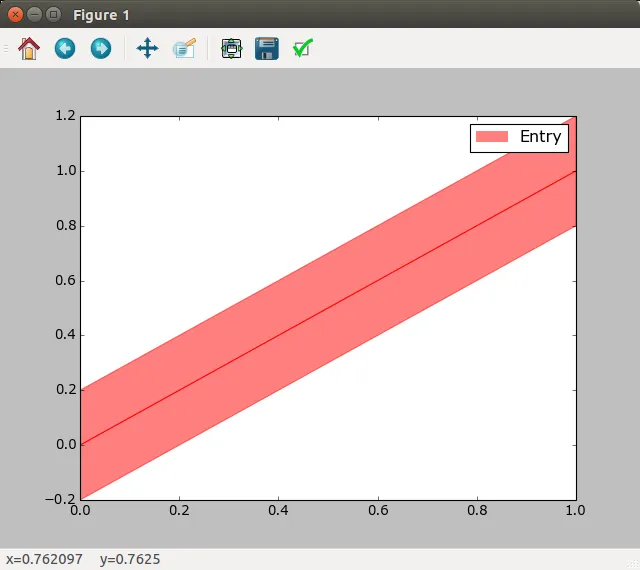
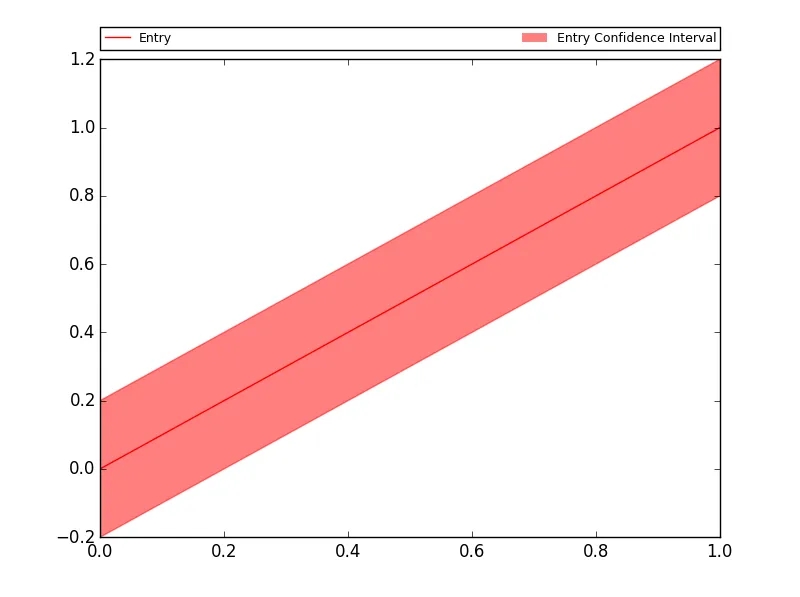
我正在尝试用置信区间绘制一些数据。我使用两个图表来表示每个数据流:plot和fill_between。我希望图例的样式与图表类似,其中每个条目都有一个框(表示置信区域的颜色)和一个通过中心的较深、实线。
到目前为止,我已经能够使用patches创建矩形图例键,但我不知道如何实现中心线。我尝试使用hatch,但无法控制其位置、粗细或颜色。
我的原始想法是尝试结合两个patches(Patch和2DLine);然而,这个方法还没有成功。是否有更好的方法?我的MWE和当前的图表如下所示。
import matplotlib.patches as mpatches
import matplotlib.pyplot as plt
import numpy as np

x = np.linspace(0,1,11)
y = np.linspace(0,1,11)

plt.plot(x, y, c='r')
plt.fill_between(x, y-0.2, y+0.2, color='r', alpha=0.5)
p = mpatches.Patch(color='r', alpha=0.5, linewidth=0)

plt.legend((p,), ('Entry',))

Figure

4个回答


2

想要深入了解此主题的人

我有一个非常类似的问题,不同之处在于我希望图例代表自定义形状(也是用plotfill_between创建的),通过虚线和填充的矩形来表示(因为这个形状具有这种模式)。下面的图片显示了示例:

example

我找到的解决方案是实现一个自定义图例处理程序,遵循Matplotlib Legend guide

特别地,我实现了一个类,它定义了一个legend_artist方法,该方法允许您通过向handlebox添加补丁来自定义处理程序(或者这就是我理解的)。

我发布了一个MWE,其中包含一个矩形,而不是模糊信息并占用大量空间的blob形状。

import matplotlib.patches as mpatches
import matplotlib.pyplot as plt


class DashedFilledRectangleHandler:
    def legend_artist(self, legend, orig_handle, fontsize, handlebox):
        x0, y0 = handlebox.xdescent, handlebox.ydescent
        width, height = handlebox.width, handlebox.height
        patch_fill = mpatches.Rectangle((x0, y0), width, height, facecolor='tab:blue', linestyle='', alpha=0.1,
                                        transform=handlebox.get_transform())
        patch_line = mpatches.Rectangle((x0, y0), width, height, fill=False, edgecolor='tab:blue', linestyle='--',
                                        transform=handlebox.get_transform())
        handlebox.add_artist(patch_line)
        handlebox.add_artist(patch_fill)
        return patch_line


fig, ax = plt.subplots()

rectangle_fill = ax.add_patch(mpatches.Rectangle((0, 0), 2, 1, facecolor='tab:blue', edgecolor='tab:blue', linestyle='',
                                                 alpha=0.1))
rectangle_line = ax.add_patch(mpatches.Rectangle((0, 0), 2, 1, fill=False, edgecolor='tab:blue', linestyle='--',
                                                 lw=3))

ax.legend([rectangle_fill], ['Dashed filled rectangle handler'],
          handler_map={rectangle_fill: DashedFilledRectangleHandler()})
ax.set_xlim([-1, 3])
ax.set_ylim([-1, 2])
plt.show()

1
我遇到了“类似”的问题。我能够通过这个问题实现以下内容,非常感谢。
fig = pylab.figure()
figlegend = pylab.figure(figsize=(3,2))
ax = fig.add_subplot(111)
point1 = ax.scatter(range(3), range(1,4), 250, marker=ur'$\u2640$', label = 'S', edgecolor = 'green')
point2 = ax.scatter(range(3), range(2,5), 250, marker=ur'$\u2640$', label = 'I', edgecolor = 'red')
point3 = ax.scatter(range(1,4), range(3),  250, marker=ur'$\u2642$', label = 'S', edgecolor = 'green')
point4 = ax.scatter(range(2,5), range(3), 250, marker=ur'$\u2642$', label = 'I', edgecolor = 'red')
figlegend.legend(((point1, point3), (point2, point4)), ('S','I'), 'center',  scatterpoints = 1, handlelength = 1)
figlegend.show()
pylab.show()

然而,我的两个(金星和火星)标记在图例中重叠。我尝试调整handlelength,但似乎没有帮助。任何建议或意见将非常有用。


我已经为您想出了一个解决方法。请创建一个新的问题并将链接作为评论发布在这里。由于字符数量的限制,我无法在评论中发布完整的示例。 - Blink
感谢@Blink。请访问https://dev59.com/Vorda4cB1Zd3GeqPP7RB。 - Mischief_Monkey

1

从你的代码开始,

这是我能提供给你的最接近的东西。可能有一种创建你想要的修补程序的方法,但我也是新手,所以我只能建立正确的传说:

import matplotlib.patches as mpatches
import matplotlib.pyplot as plt
import numpy as np

x = np.linspace(0,1,11)
y = np.linspace(0,1,11)

fig = plt.figure()
ax = fig.add_subplot(111)
plt.plot(x, y, c='r',label='Entry')
plt.fill_between(x, y-0.2, y+0.2, color='r', alpha=0.5)
p_handle = [mpatches.Patch(color='r', alpha=0.5, linewidth=0)]
p_label = [u'Entry Confidence Interval']
handle, label = ax.get_legend_handles_labels()
handles=handle+p_handle
labels=label+p_label
plt.legend(handles,labels,bbox_to_anchor=(0. ,1.02 ,1.,0.3),loc=8,
           ncol=5,mode='expand',borderaxespad=0,prop={'size':9},numpoints=1)

plt.show()

enter image description here

根据我的了解,您需要创建一个符合所需设计的"艺术家"对象,但我找不到创建方法。此线程中可以找到一些类似的示例: 自定义图例主题。希望这有所帮助,祝您好运。如果有更深入的方法,我也很感兴趣。

谢谢你的提示!我实际上能够通过以下链接使它工作:https://dev59.com/wGox5IYBdhLWcg3wWjDQ。请查看我的答案以获取详细示例。 - Blink

网页内容由stack overflow 提供, 点击上面的
可以查看英文原文,
原文链接