1个回答
4

UI服务仅在2014年12月11日几天前被弃用。
以下是一步一步的说明:
创建附加到您的网站的应用程序脚本
- 在您的Google网站中 - 点击带有齿轮图标的按钮
- 选择“管理网站”
- 点击“应用脚本”选项
- 单击“添加新脚本”按钮
- 选择“脚本为Web应用程序”
将doGet()函数中的代码替换为以下内容:
function doGet() {
  return HtmlService.createHtmlOutputFromFile('index')
      .setSandboxMode(HtmlService.SandboxMode.IFRAME);
}
保存它。 给项目命名。
创建一个index.html文件
- 选择文件,新建,HTML文件
在HTML文件中输入以下内容:
<html>
  <head>
    <script type="text/javascript" src="https://www.google.com/jsapi"></script>
    <script type="text/javascript">
      google.load("visualization", "1", {packages:["timeline"]});
      google.setOnLoadCallback(drawChart);

      function drawChart() {
        var container = document.getElementById('timeline');
        var chart = new google.visualization.Timeline(container);
        var dataTable = new google.visualization.DataTable();

        dataTable.addColumn({ type: 'string', id: 'President' });
        dataTable.addColumn({ type: 'date', id: 'Start' });
        dataTable.addColumn({ type: 'date', id: 'End' });
        dataTable.addRows([
          [ 'Washington', new Date(1789, 3, 29), new Date(1797, 2, 3) ],
          [ 'Adams',      new Date(1797, 2, 3),  new Date(1801, 2, 3) ],
          [ 'Jefferson',  new Date(1801, 2, 3),  new Date(1809, 2, 3) ]]);

        chart.draw(dataTable);
      }
    </script>
  </head>
  <body>
    <div id="timeline" style="width: 900px; height: 180px;"></div>
  </body>
</html>
- 保存新的 index.html 文件。
发布您的 Apps Script
- 点击“发布”。
- 点击“部署为网络应用程序”。
- 如果没有版本,请保存一个新版本。
- 点击底部的“更新”按钮。
将 Apps Script 小工具添加到您的网站页面中
- 返回您的网站页面。
- 单击带有铅笔图标的“编辑页面”按钮。
- 单击“插入”菜单。
- 选择“Apps Script”。
- 选择一个脚本。
- 单击“选择”按钮。
保存所有更改。
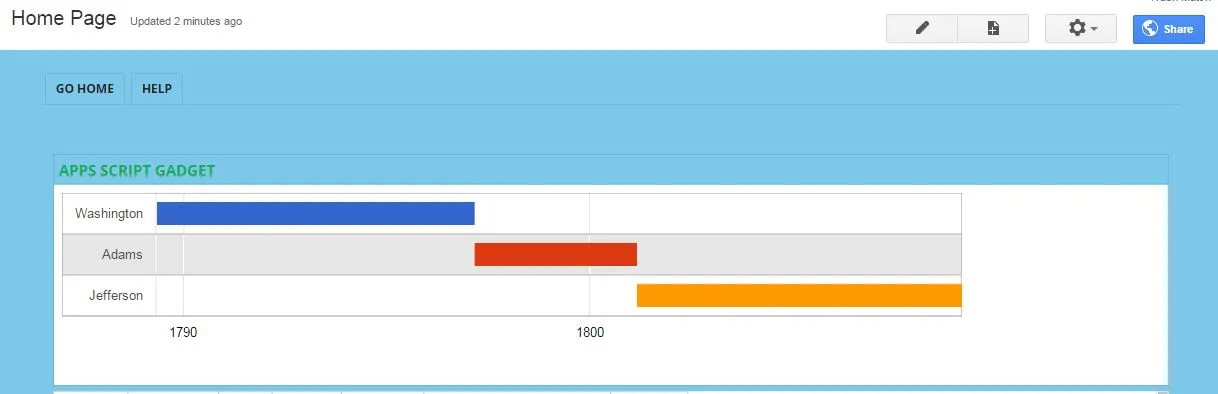
您应该会得到类似以下内容的东西:
现在,您已经设置好了 .gs 代码和 HTML,您需要修改 HTML 文件的 SCRIPT 标签中的 JavaScript。
您需要运行一个 google.script.run API,以触发 .gs 文件中的另一个函数,该函数将获取您的数据。
Google 文档 - Class google.script.run (客户端 API)
查看该文档,并了解其功能。
index.html 文件中的新代码将类似于以下内容:
<script>
  function onSuccess(importedData) {
    dataTable.addRows([importedData]);
    chart.draw(dataTable);
    alert('Your data has been loaded');
  }

  google.script.run.withSuccessHandler(onSuccess)
      .retrieveChartData();
</script>
硬编码数据将被替换为代码。这是必须删除并更改为其他内容的硬编码数据:
    dataTable.addRows([
      [ 'Washington', new Date(1789, 3, 29), new Date(1797, 2, 3) ],
      [ 'Adams',      new Date(1797, 2, 3),  new Date(1801, 2, 3) ],
      [ 'Jefferson',  new Date(1801, 2, 3),  new Date(1809, 2, 3) ]]);
您需要在您的
.gs脚本文件中添加另一个函数。例如:function retrieveChartData() {
Logger.log('I was called!');
//Get the data from your data source
Code here
var tableData = code here;
//return the data
return tableData;
}
- Alan Wells
2
当我获取要传递给图表的数据时,是否需要为所有数据创建一个对象?这就是dataTable.addRows的样子。还是说我可以从.gs文件传递变量到html文件中? - JForgie
您IP地址为143.198.54.68,由于运营成本限制,当前对于免费用户的使用频率限制为每个IP每72小时10次对话,如需解除限制,请点击左下角设置图标按钮(手机用户先点击左上角菜单按钮)。 - Alan Wells
网页内容由stack overflow 提供, 点击上面的可以查看英文原文,
原文链接
原文链接