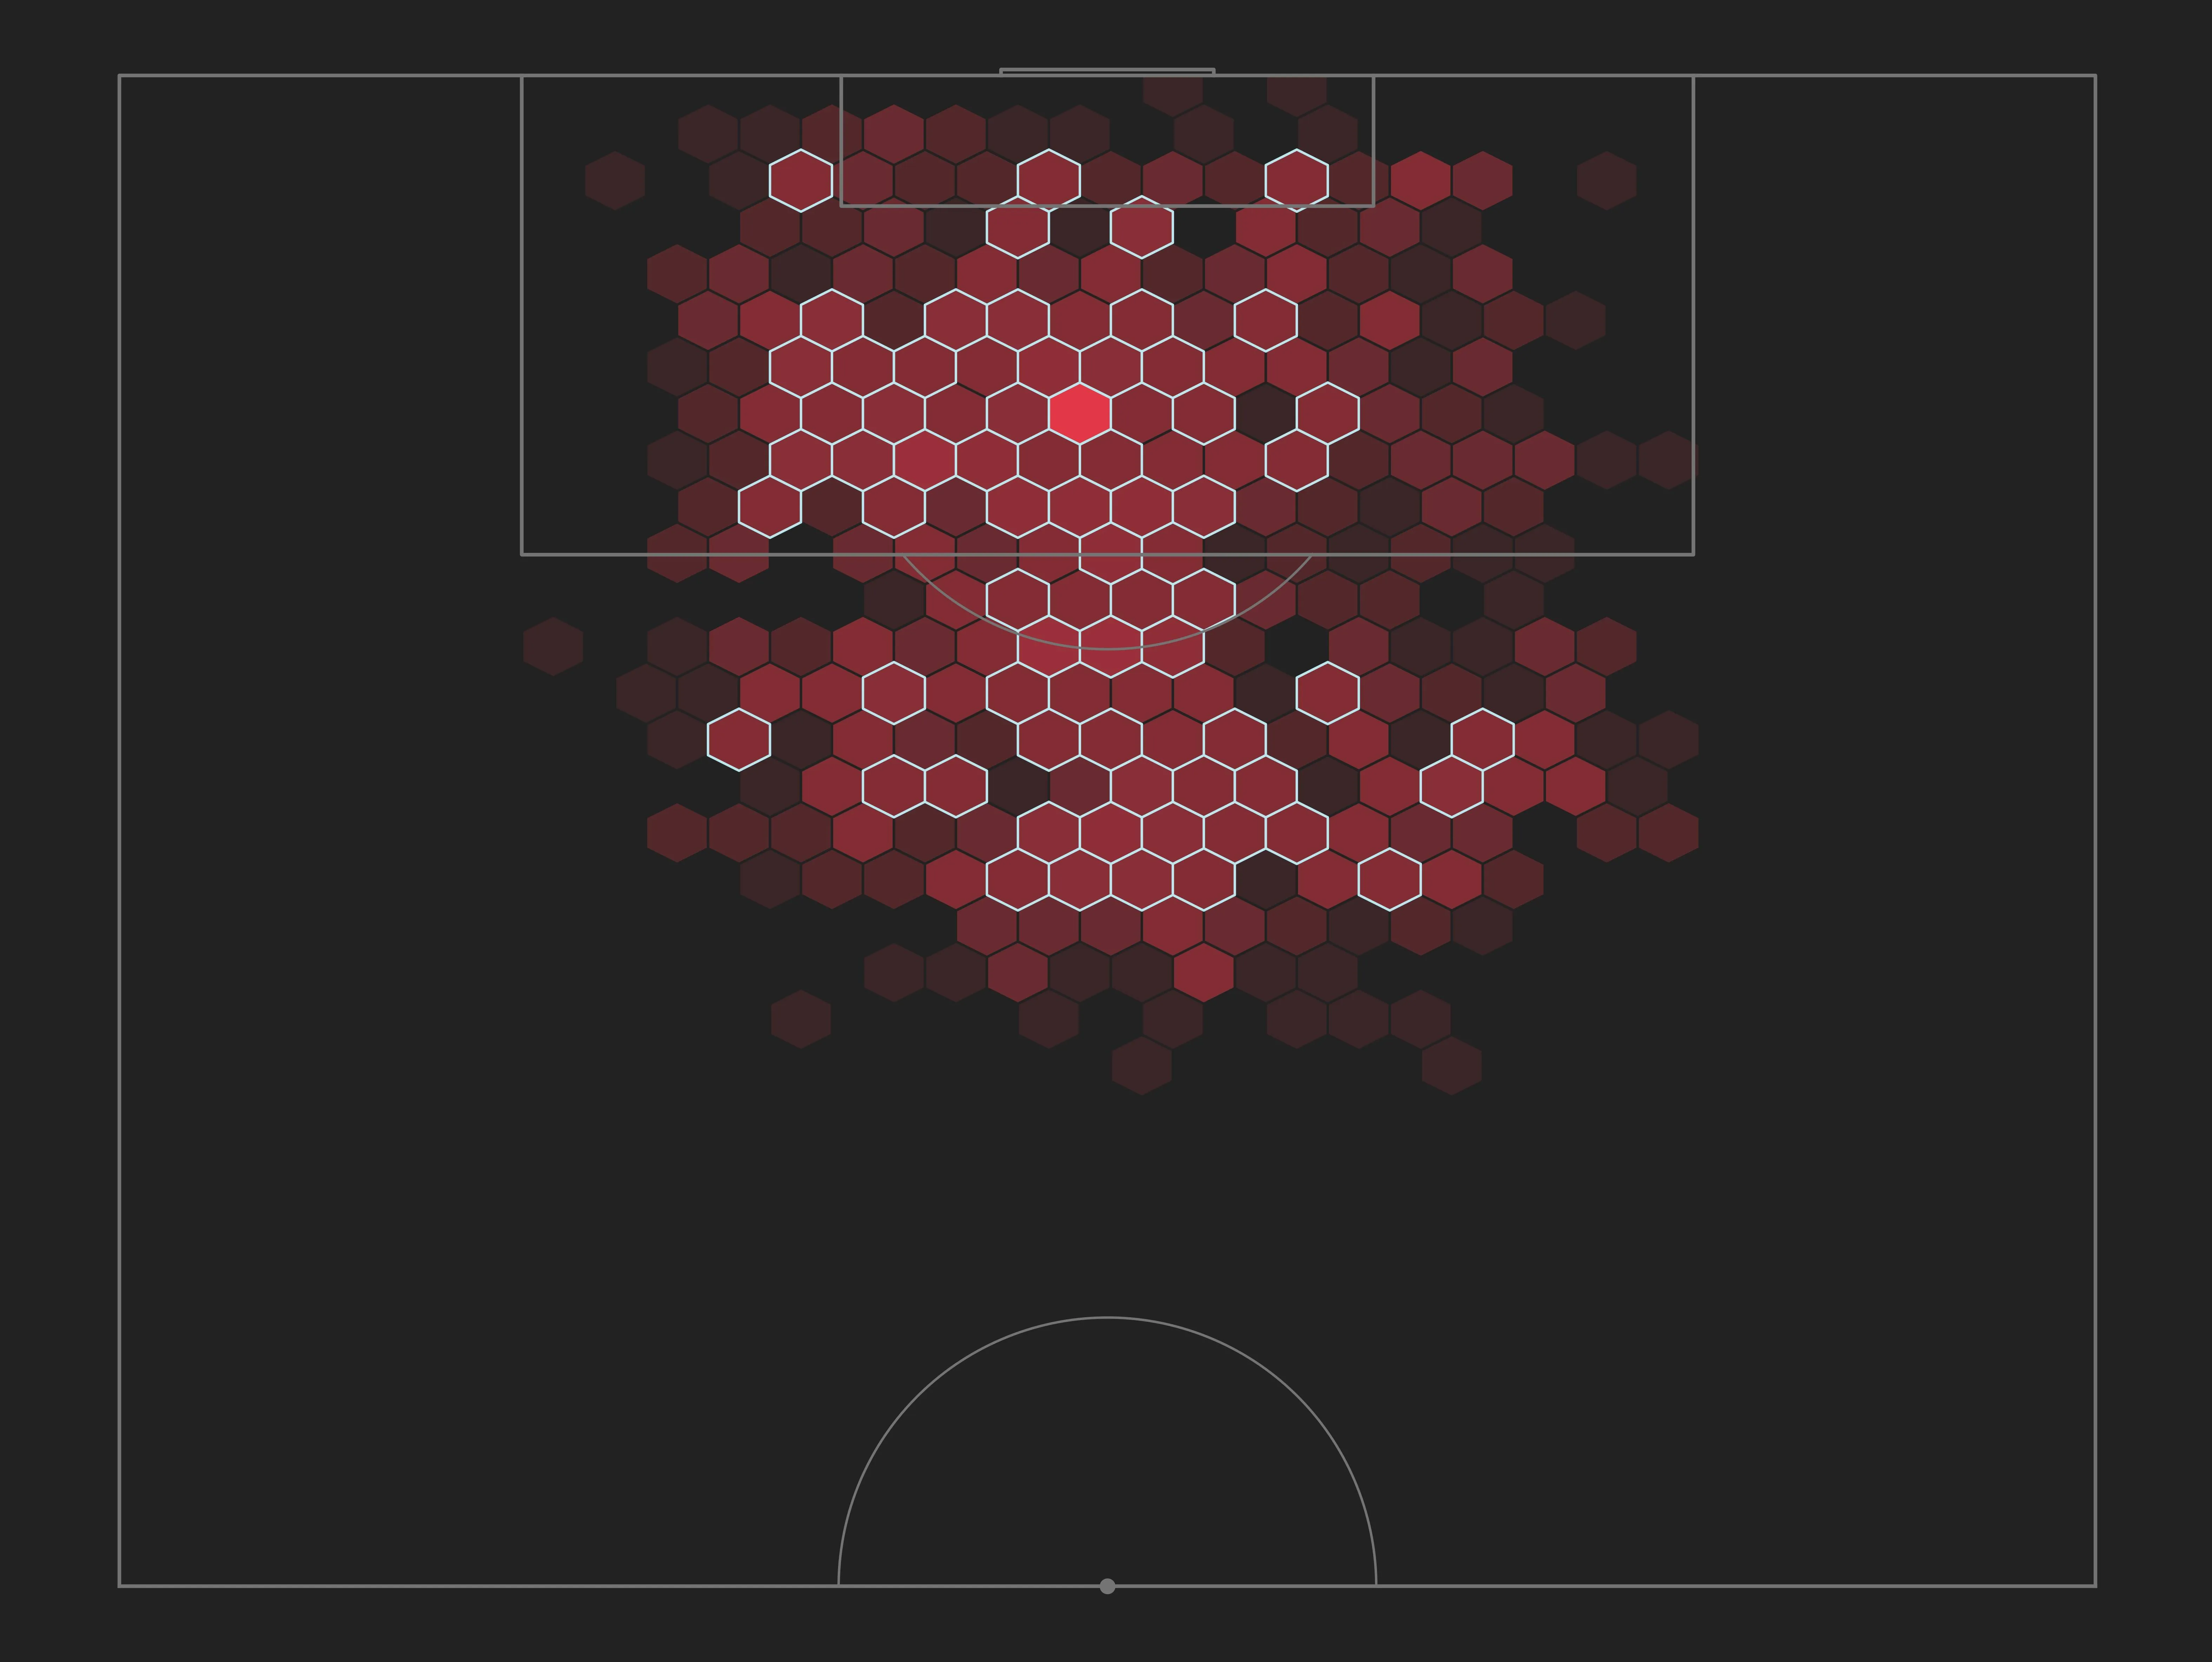
我正在使用以下Python脚本制作六边形图:
pitch = Pitch(
    line_color="#747474", pitch_color="#222222", orientation="vertical", half=True, plot_arrow=False
)

fig, ax = pitch.create_pitch()

## color-map
cmap = [
    "#222222", "#3A2527", "#52282B", "#6A2B30",
    "#762C32", "#822D34", "#8E2F37", "#9A3039",
    "#B2323D", "#BE3440", "#CA3542", "#E13746"
]
cmap = colors.ListedColormap(cmap)

hexbin = ax.hexbin(
    68 - shots_data['Y'], shots_data['X'], zorder=3, cmap=cmap,
    extent=(0, 68, 52, 104), gridsize=22, bins=13, ec="#222222", lw=3
)
上面的代码生成以下输出:
 编辑:
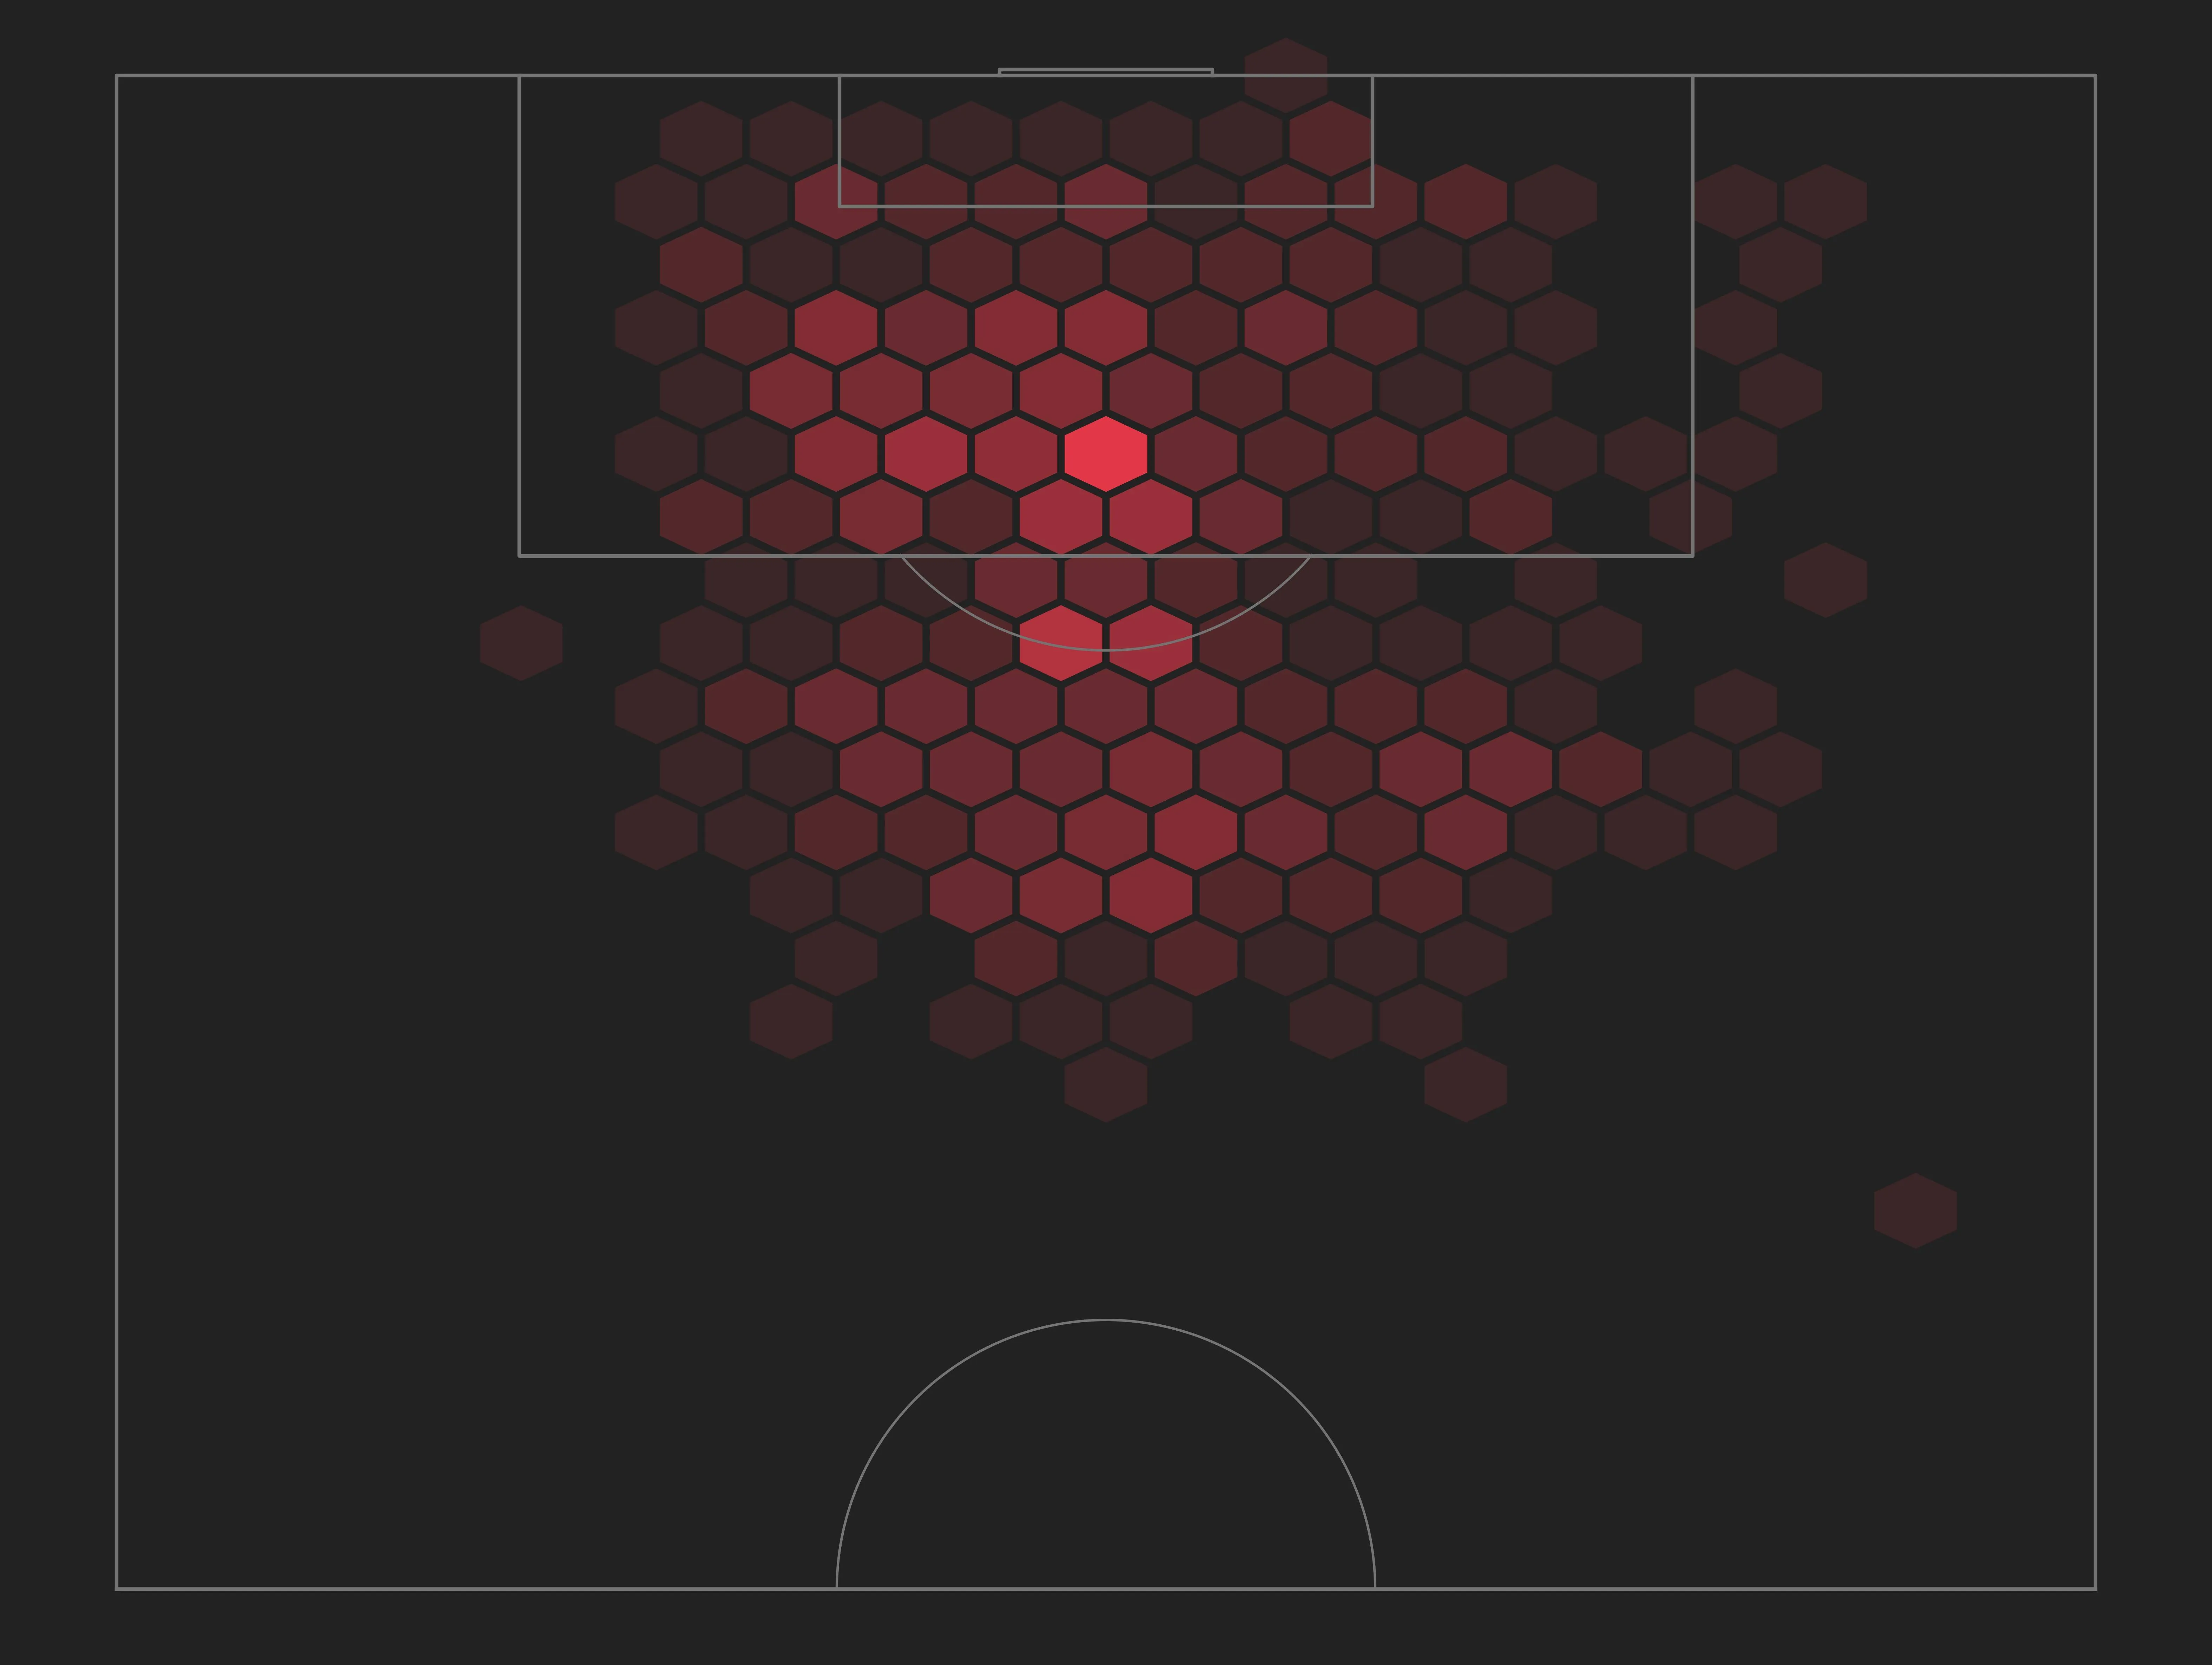
编辑:我得到了一些结果,但它们并不完美,以下是更新后的脚本:
## Pitch obejct
pitch = Pitch(
line_color="#747474", pitch_color="#222222", orientation="vertical", half=True, plot_arrow=False
)
## create-pitch
fig, ax = pitch.create_pitch()
## colormap
cmap = [
"#3A2527", "#52282B", "#6A2B30", "#822D34",
"#822D34","#882E36", "#8E2F37", "#9A3039", "#B2323D", "#E13746"
]
cmap = colors.ListedColormap(cmap)
## extent
extent = (
shots_data['Y'].min(), shots_data['Y'].max(),
shots_data['X'].min(), shots_data['X'].max(),
)
## main hexbin
hexbin = ax.hexbin(
68 - shots_data['Y'], shots_data['X'], zorder=3, cmap=cmap,
extent=extent, gridsize=22, ec="#222222", lw=1, bins="log", mincnt=1
)
## hexbin with mincnt=6
cmap = [
"#822D34", "#882E36", "#8E2F37", "#9A3039", "#B2323D", "#E13746"
]
cmap = colors.ListedColormap(cmap)
ax.hexbin(
68 - shots_data['Y'], shots_data['X'], zorder=3, cmap=cmap,
extent=extent, gridsize=22, ec="#bce7ef", lw=1, bins="log", mincnt=6
)
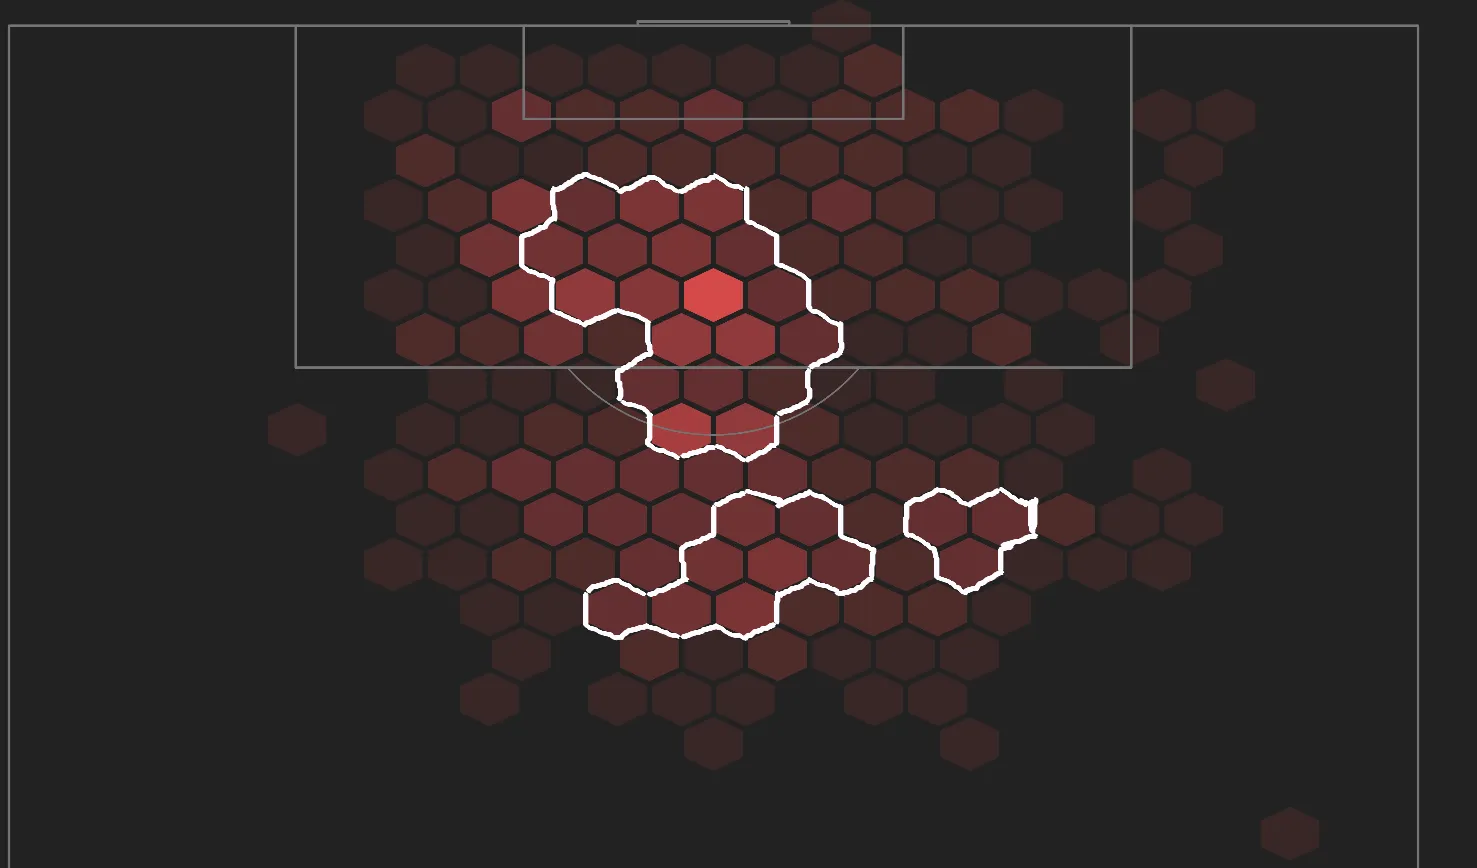
## add rectangle
rect = plt.Rectangle(
xy=(-0.1, 104), width=68.1, height=1, zorder=3, fc="#222222"
)
ax.add_patch(rect)
这将产生以下结果: